Introduction
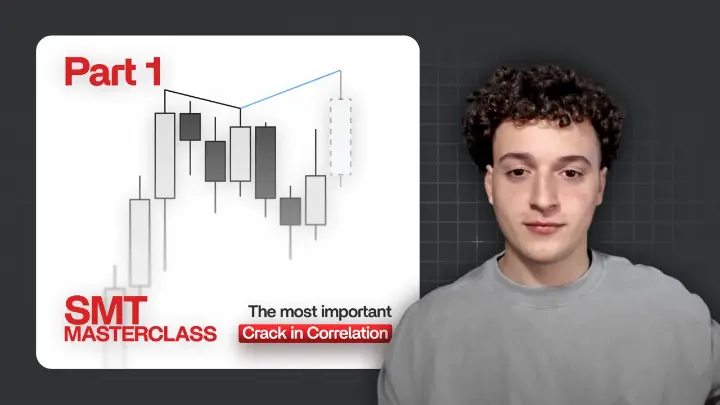
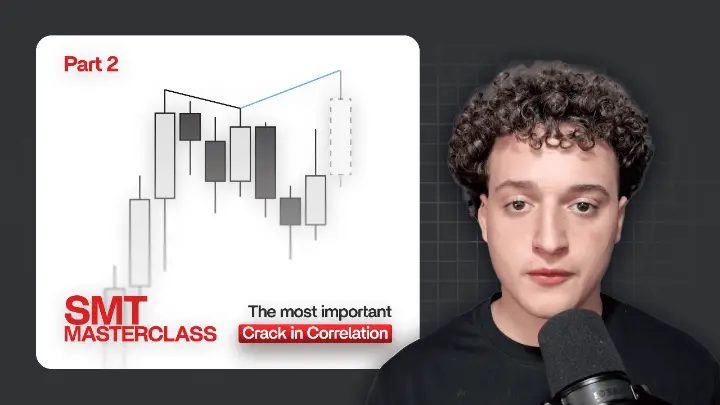
In this lecture we cover 2-stage SMT, or 2-stage cracks in correlation, and how I use them in my trading. It follows on from Part 1 on one-stage cracks in correlation.
One thing to be clear on before we start. The 2-stage does not have to be on the same time frame: you can use a 2-stage between fractal candles as long as they are aligned. For example, a 4-hour Consecutive Candle SMT confirmed by a 1-hour PSP.
How To Use 2-Stage SMT In Your Trading
2-Stage SMT
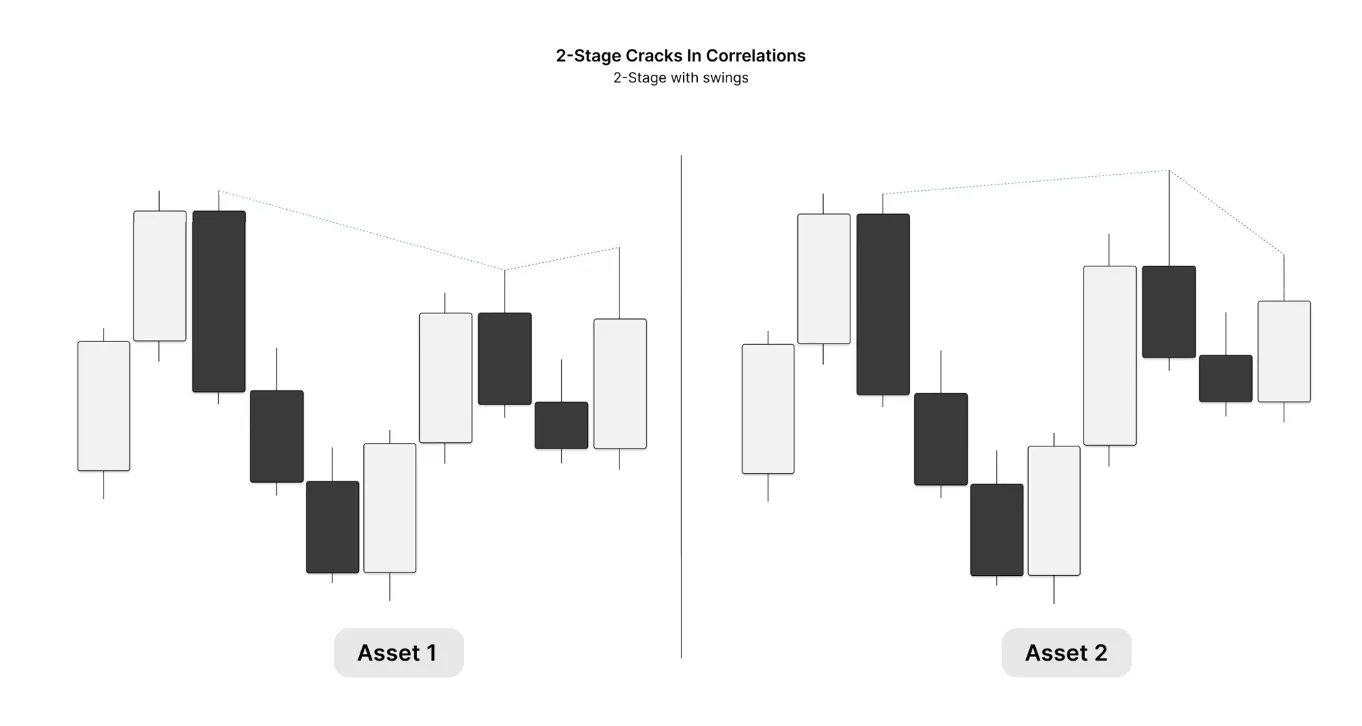
Asset two sweeps the first high while asset one fails to; price retraces, fails to reverse, and then asset one sweeps the next high while asset two fails to. That is a 2-stage SMT: a crack in correlation at the first high and another at the next.
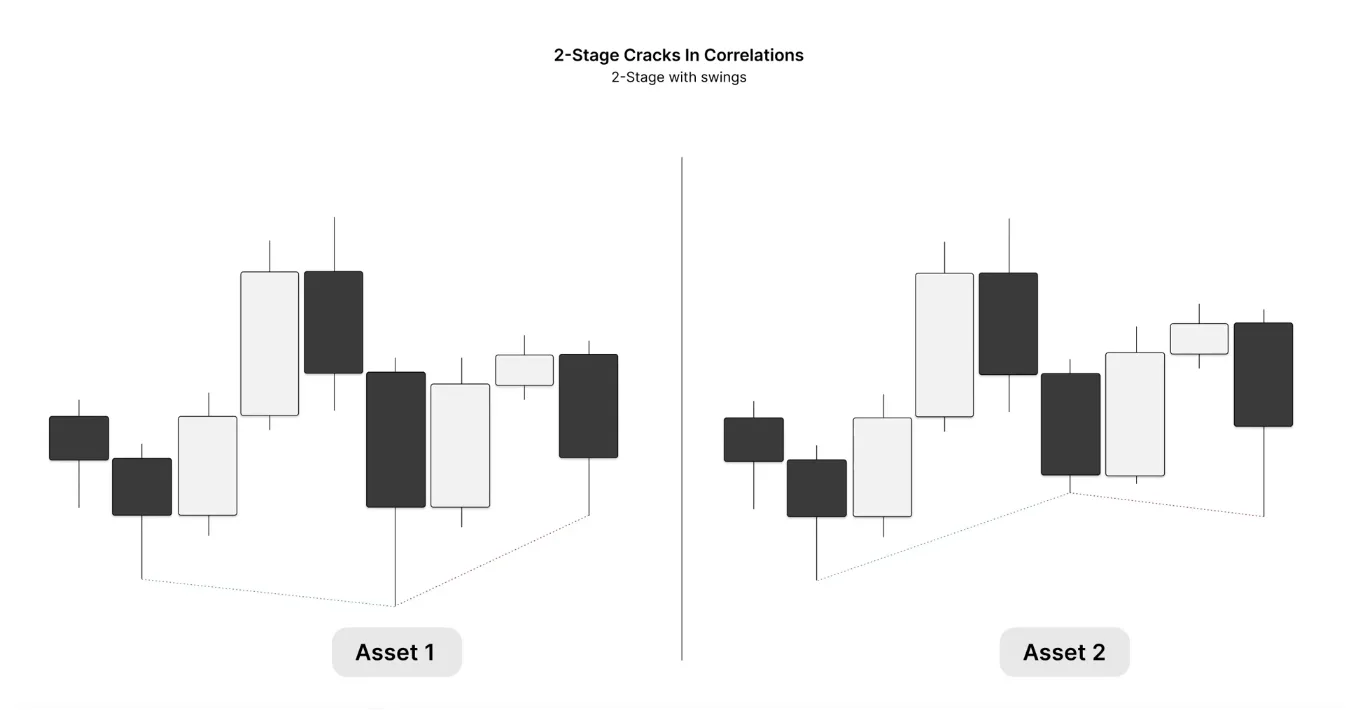
The bullish example is the opposite. Asset one sweeps the first swing low while asset two does not, the first crack in correlation; then asset two sweeps the next low while asset one does not, the second crack in correlation.
Consecutive Candle 2-Stage SMT
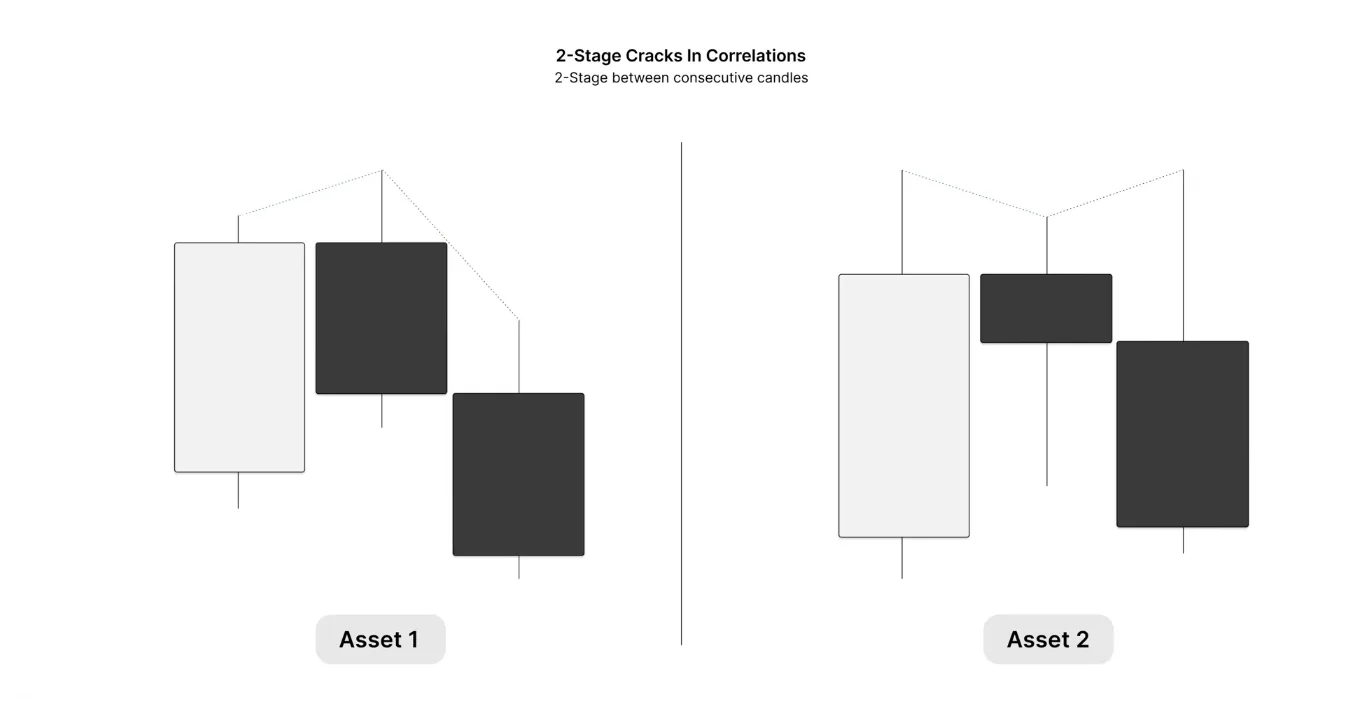
First, SMT with the first candle's high: asset one sweeps the candle's high while asset two fails to. Then asset two opens and sweeps out the next candle's high while asset one fails to. That is a 2-stage crack in correlation between consecutive candles, in a bearish context.
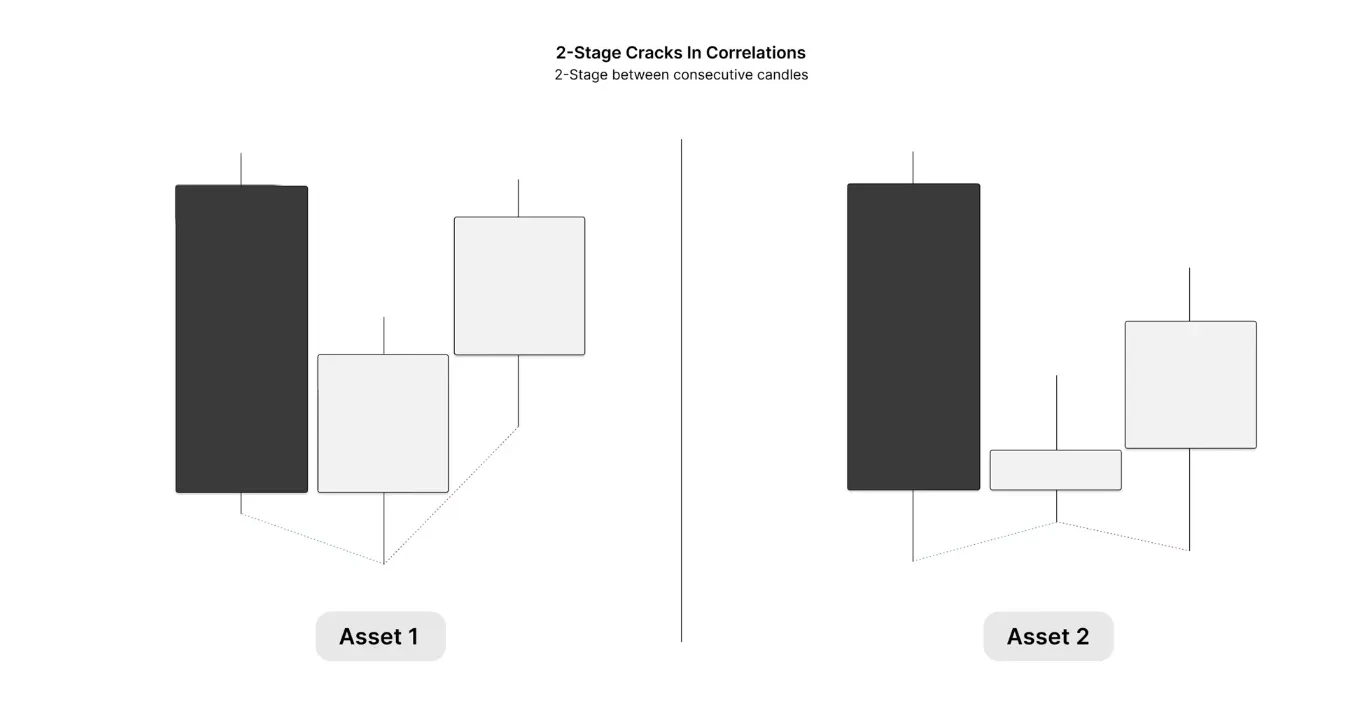
The bullish context is the same in reverse. Asset one sweeps the previous candle's low while asset two does not, and then asset two sweeps the previous candle's low while asset one does not, asset one staying stronger through that signature.
2-Stage Between FVGs
Now a 2-stage between gaps. In a bullish gap, price trades into it on asset one while asset two does not. Then asset one opens the next candle and fails to take the previous candle's low, while asset two sweeps it and prints the second-stage crack in correlation.
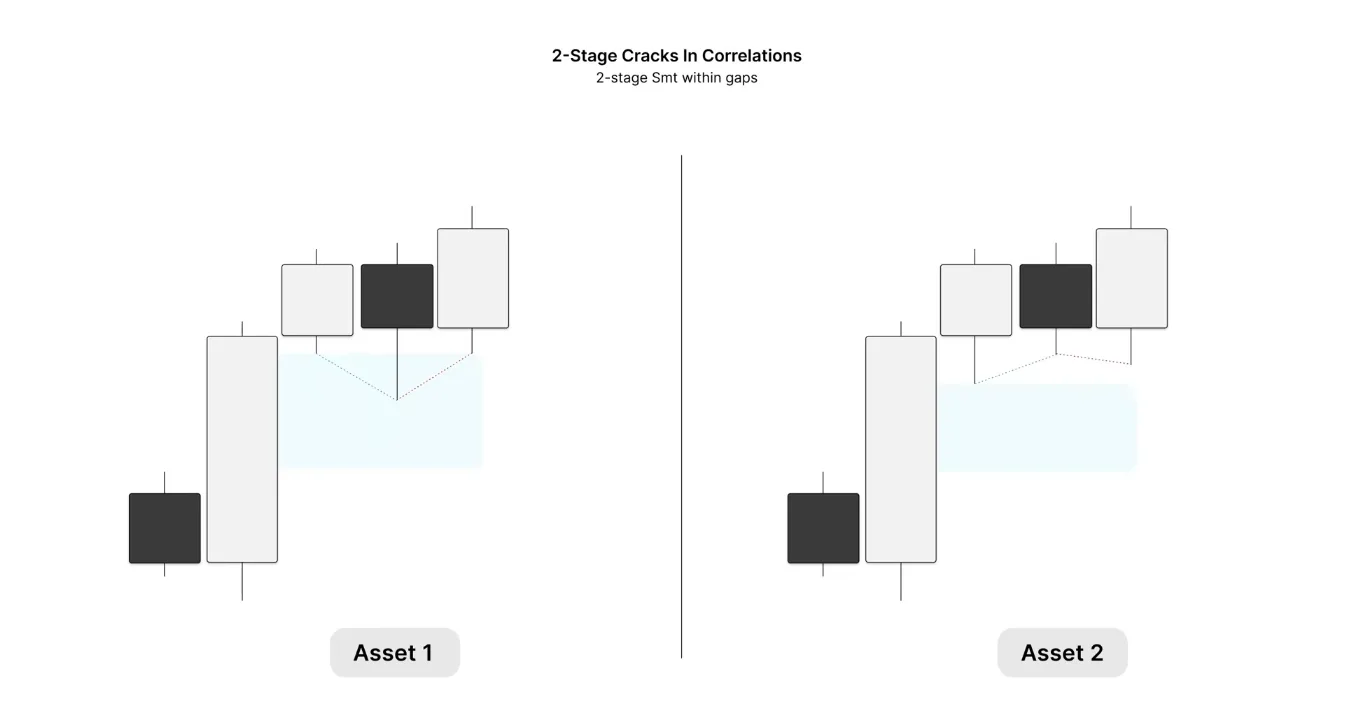
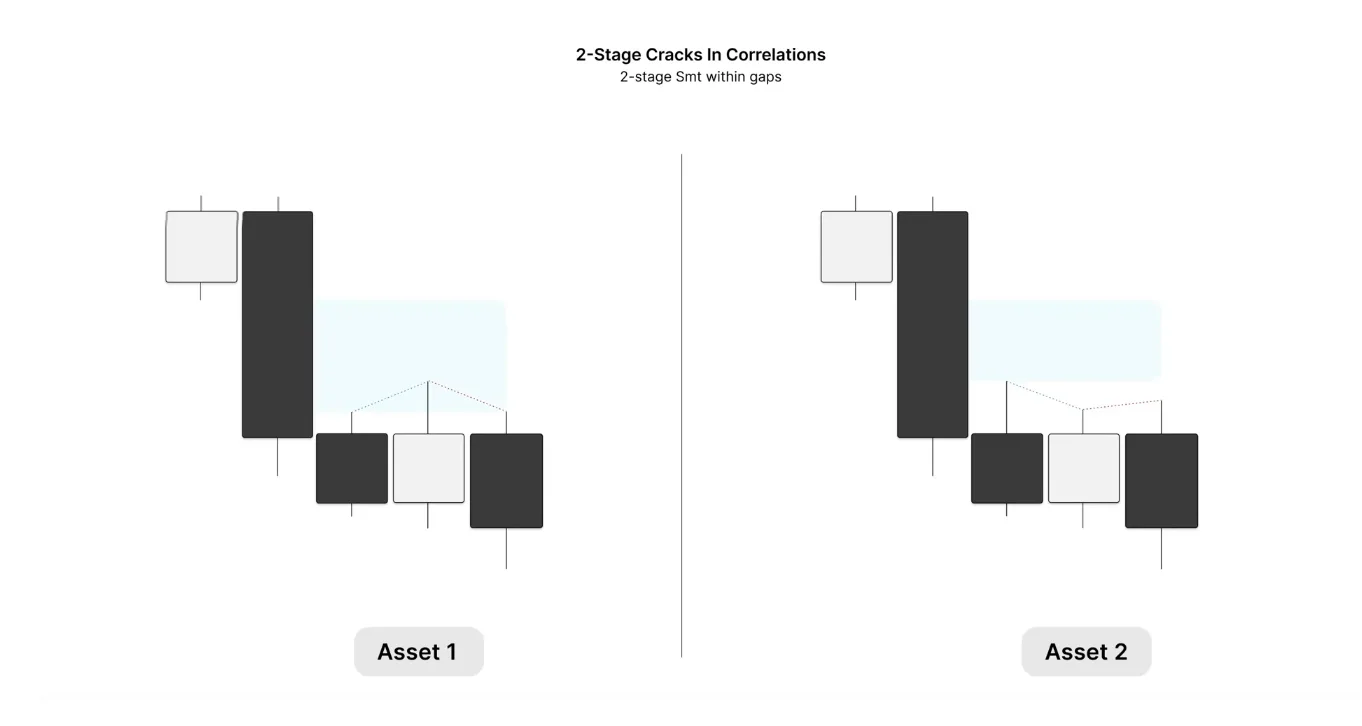
The bearish context is the opposite. Asset one trades into the gap while asset two does not; then asset one opens the next candle and fails to manipulate the previous candle's high, while asset two takes it. That is the second-stage crack in correlation that we then want to see price expand away from.
Learning it alone isn’t easy...
Learn The Lathyrus Model with direct guidance from our coaches.
- 10 live streams every week
- Regularly updated in-depth course
- 450+ hours of live stream recordings
+ more
2-Stage PSPs
A 2-stage crack in correlation between C1 and C2 using a PSP. On asset one, C1's high does not get taken by C2, while on asset two C2 does sweep C1's high. Asset two then closes the candle as a bullish candle and asset one as a bearish candle, so it is a PSP. To keep it as simple as possible: a PSP is when the same candle on correlated assets, at the same time, closes as a different color.
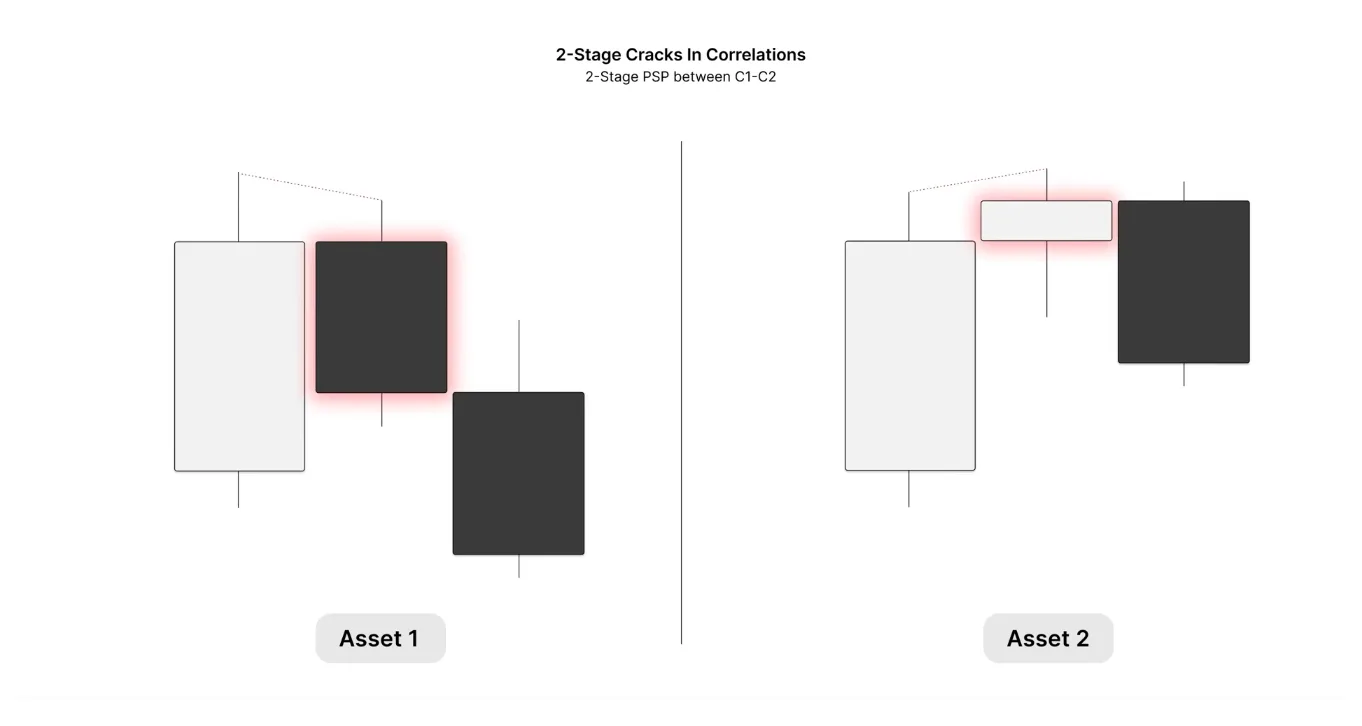
In the bullish case, asset one does not sweep C1's low and asset two does, the first-stage crack in correlation. Then the candle closes as a PSP, bullish on asset one and bearish on asset two, the second-stage crack we want to see price deliver from.
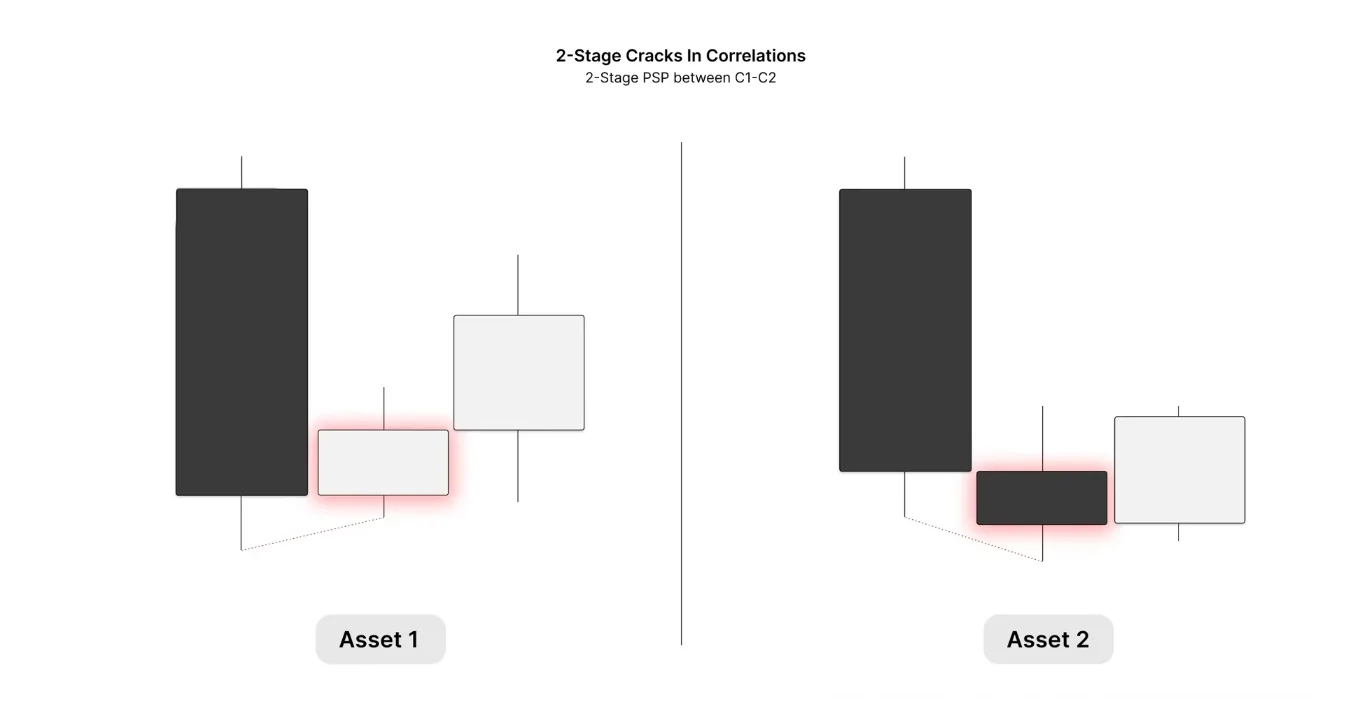
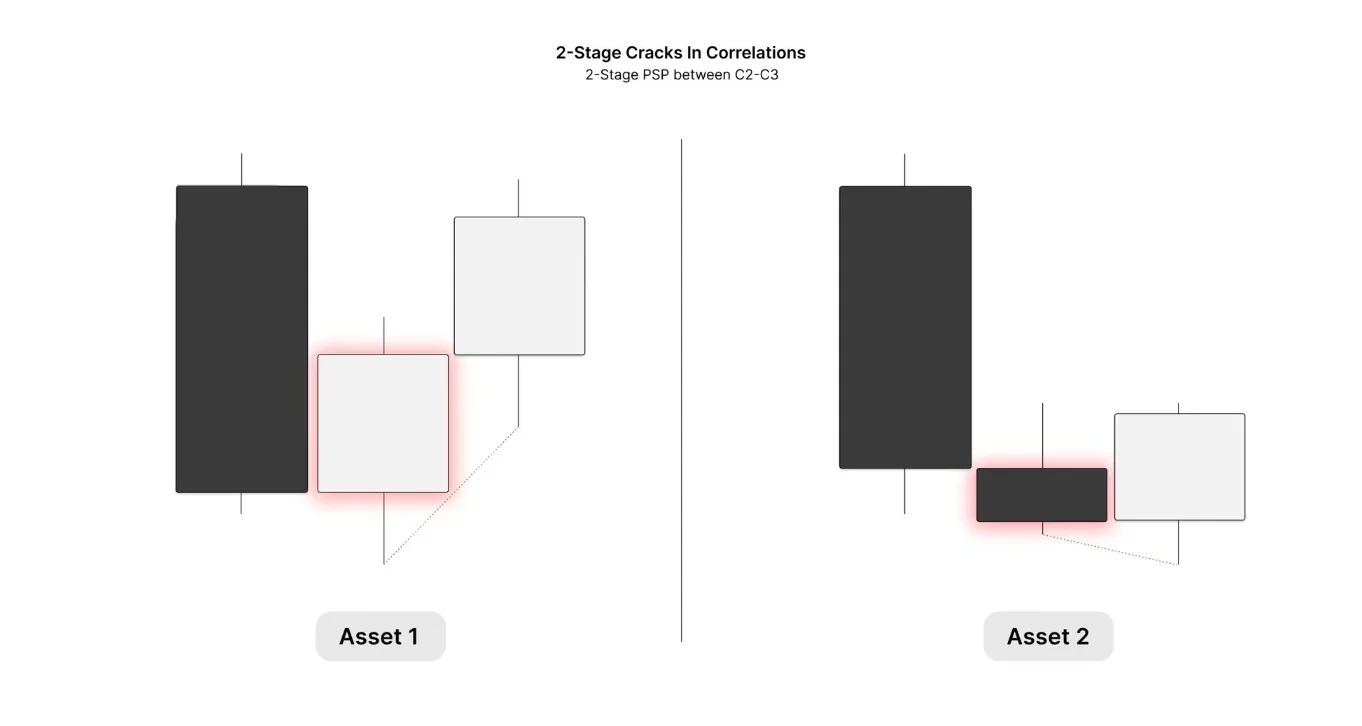
2-stage PSPs between C2 and C3. Here the candle closes as a PSP, bearish on asset one and bullish on asset two. Then asset two sweeps the high of that candle while asset one does not, confirming the second-stage crack in correlation that we want to see price deliver from.
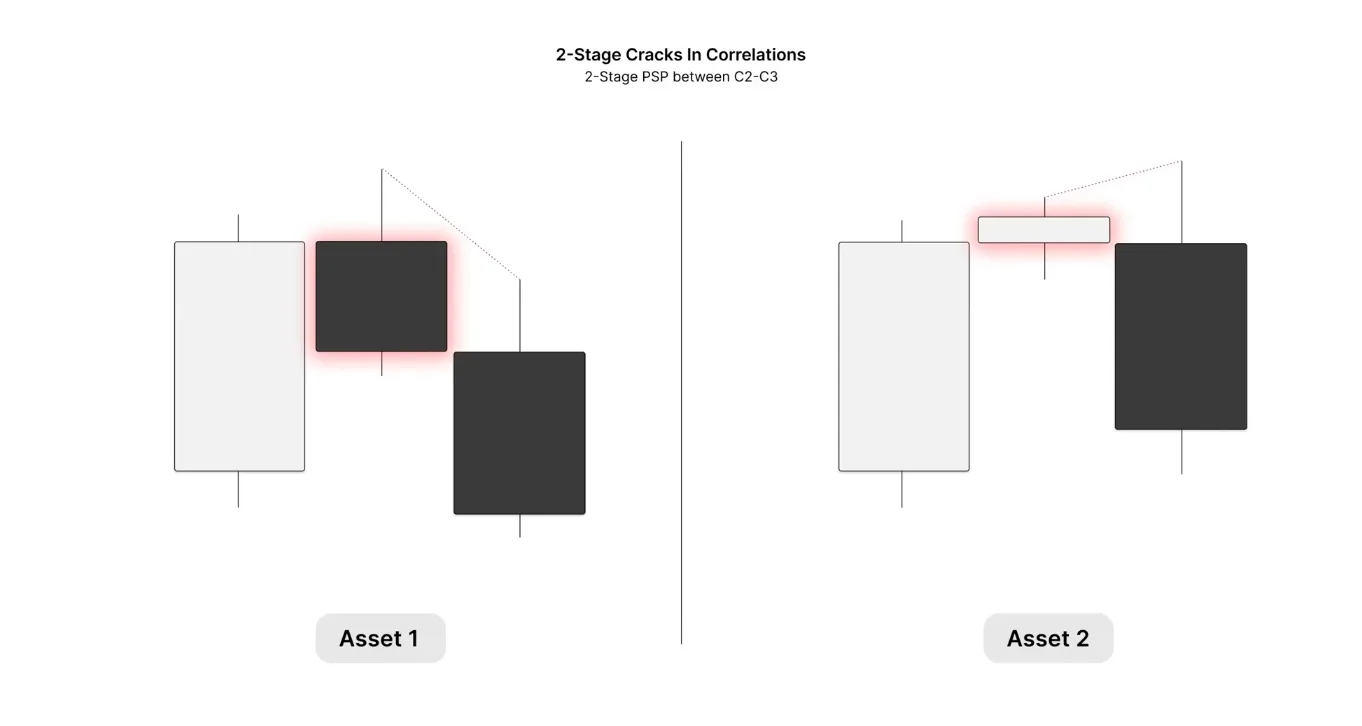
The bullish context is the same in reverse: the candle forms bullish on asset one and bearish on asset two, a PSP, and then asset two sweeps that candle's low while asset one does not, the second-stage crack.
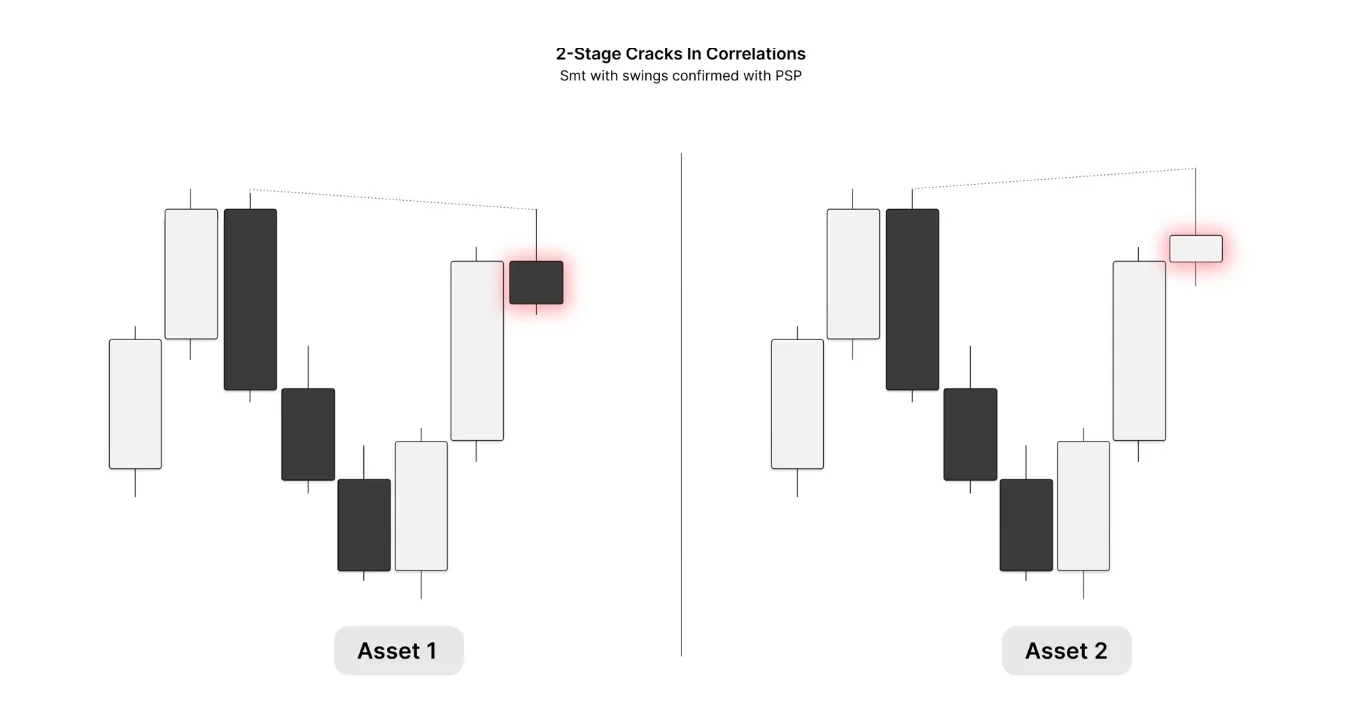
SMT with swings confirmed by a PSP. This is when price sweeps a swing high but does not get a 2-stage SMT at the swing; instead it gets a PSP. Asset one fails to take the high, asset two sweeps it, and the candle closes bearish on asset one while asset two forms a bullish candle. That PSP is the second stage, and we want to see price expand away.
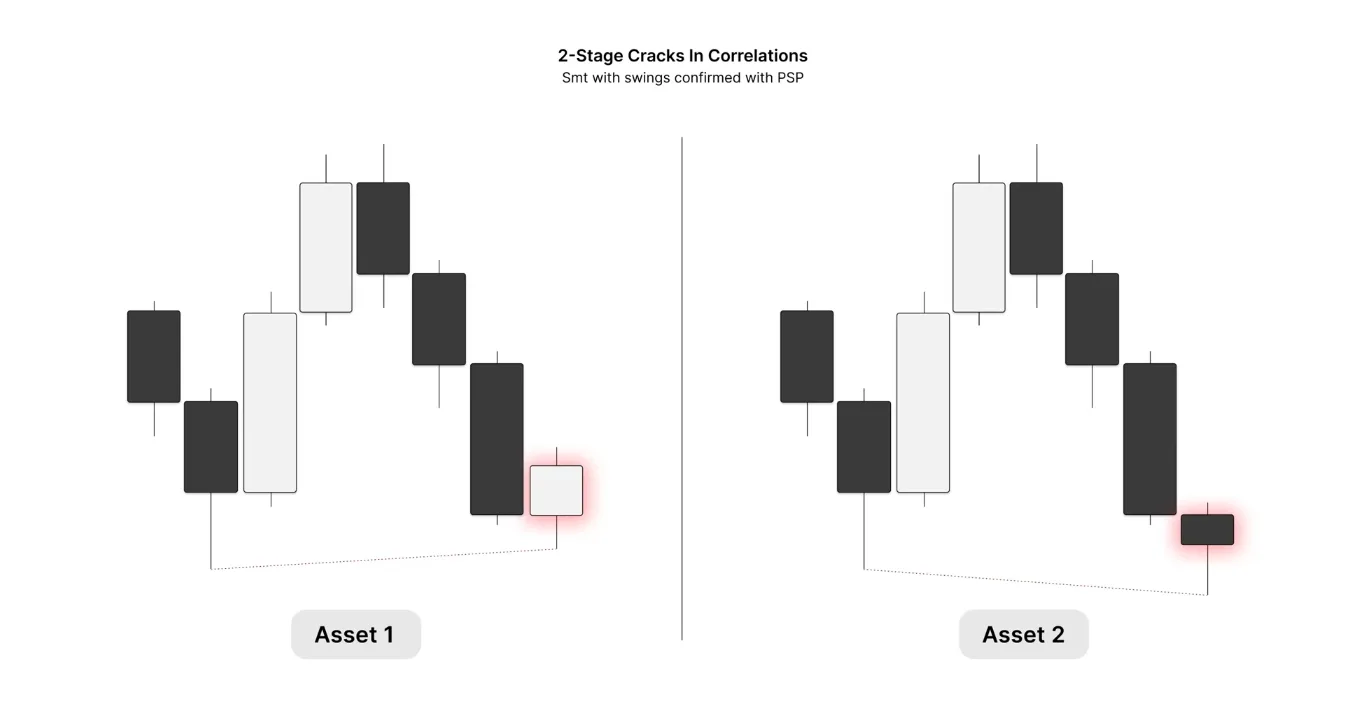
Again in the bullish case, asset one does not sweep the previous low while asset two does, the first-stage crack, and then the close of the PSP creates the second-stage crack we want to see price trade away from. This is when a PSP confirms the SMT as its second-stage crack in correlation.
2-Stage PSPs Between FVGs
2-stage PSPs within gaps are when price trades into a gap, forms a PSP within it, and then we want to see price deliver away from it. Asset one trades into the gap while asset two does not: the first-stage crack in correlation, an SMT fill. Then the candle closes as a PSP: the second-stage crack we want to see price trade away from.
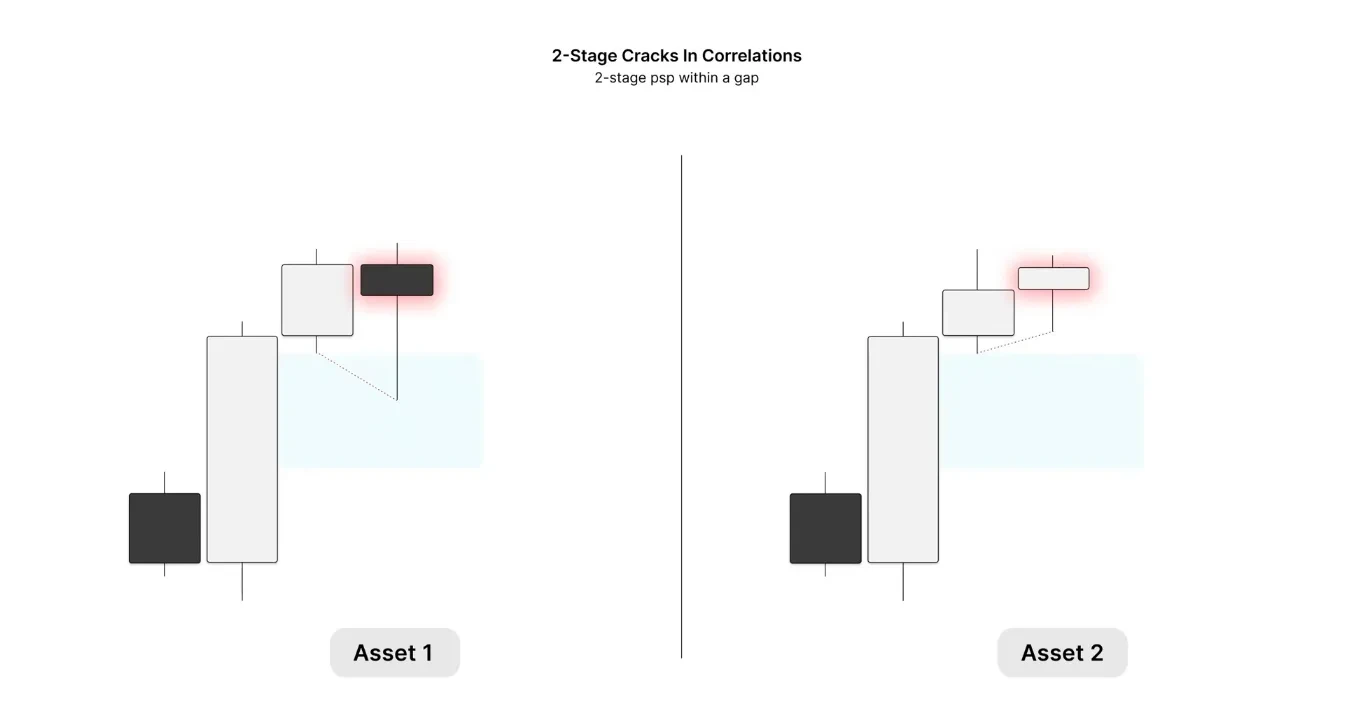
The bearish context is the same: asset one trades into the gap while asset two fails to, creating the SMT fill, and then the PSP closure on both assets confirms the second stage, and we want to see price trade away.
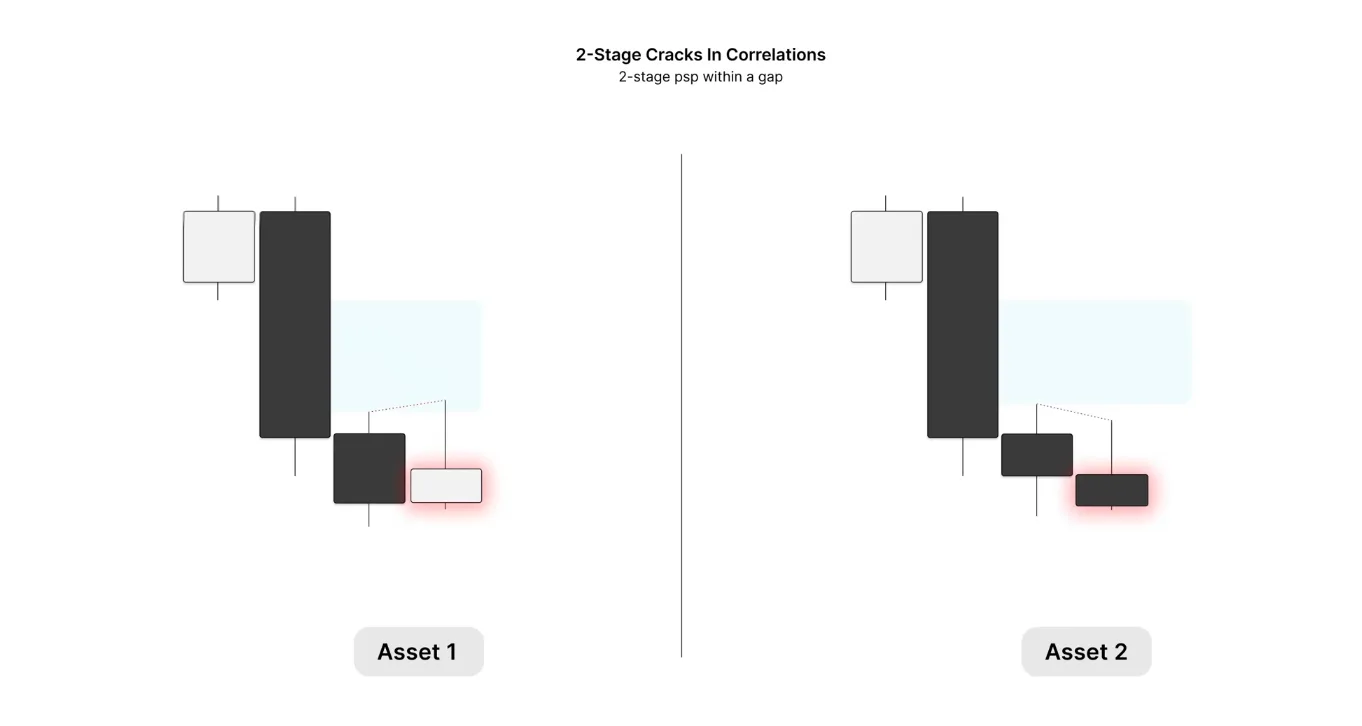
A quick disclaimer: for continuations I do not require a 2-stage; I can trade away from a continuation with one stage. A continuation is essentially defined by a fair value gap, so all trades from a fair value gap can be taken with one stage.
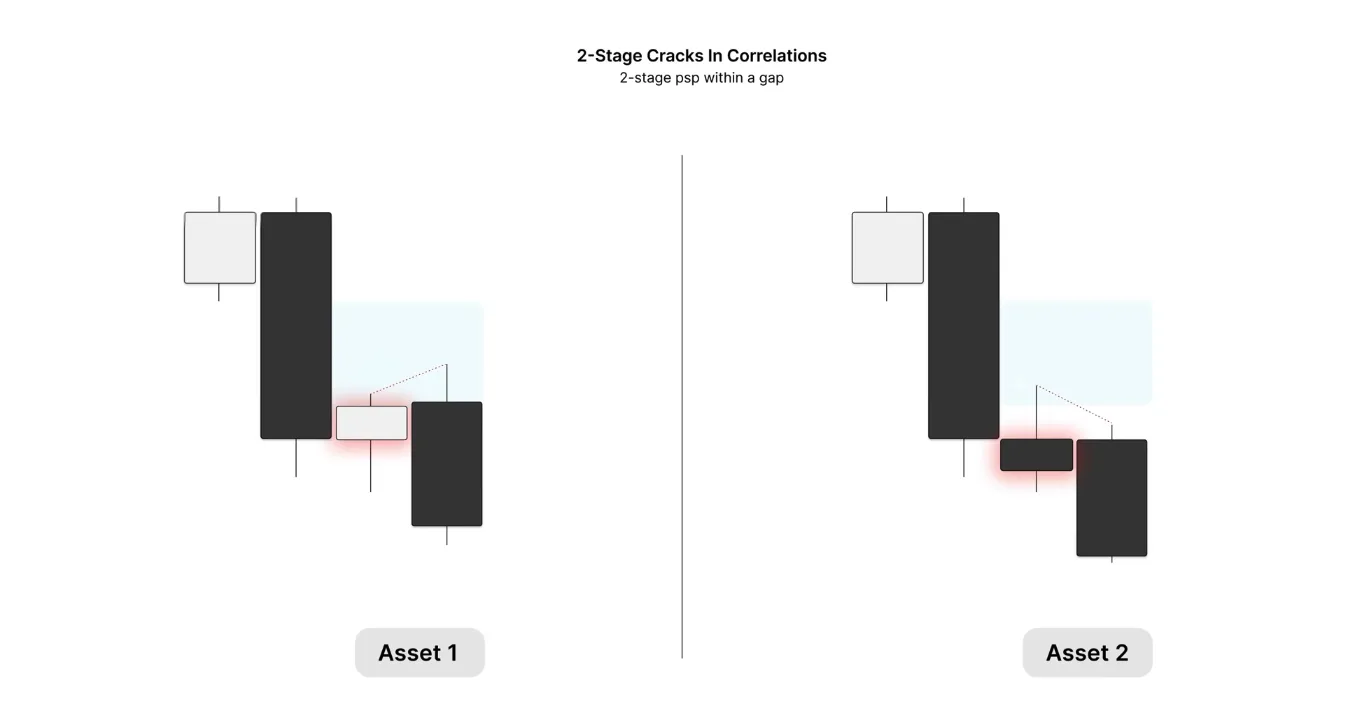
There is also the 2-stage PSP within a gap where the PSP forms the gap. The candle that forms the low of the gap closes as a PSP, bearish on asset one and bullish on asset two. Then asset one trades into the gap, creating a 2-stage with that PSP's low: an SMT fill, but also SMT with the PSP candle's low, while asset two fails to trade into the gap. This is when the SMT confirms the PSP, and we want to see price trade away from it.
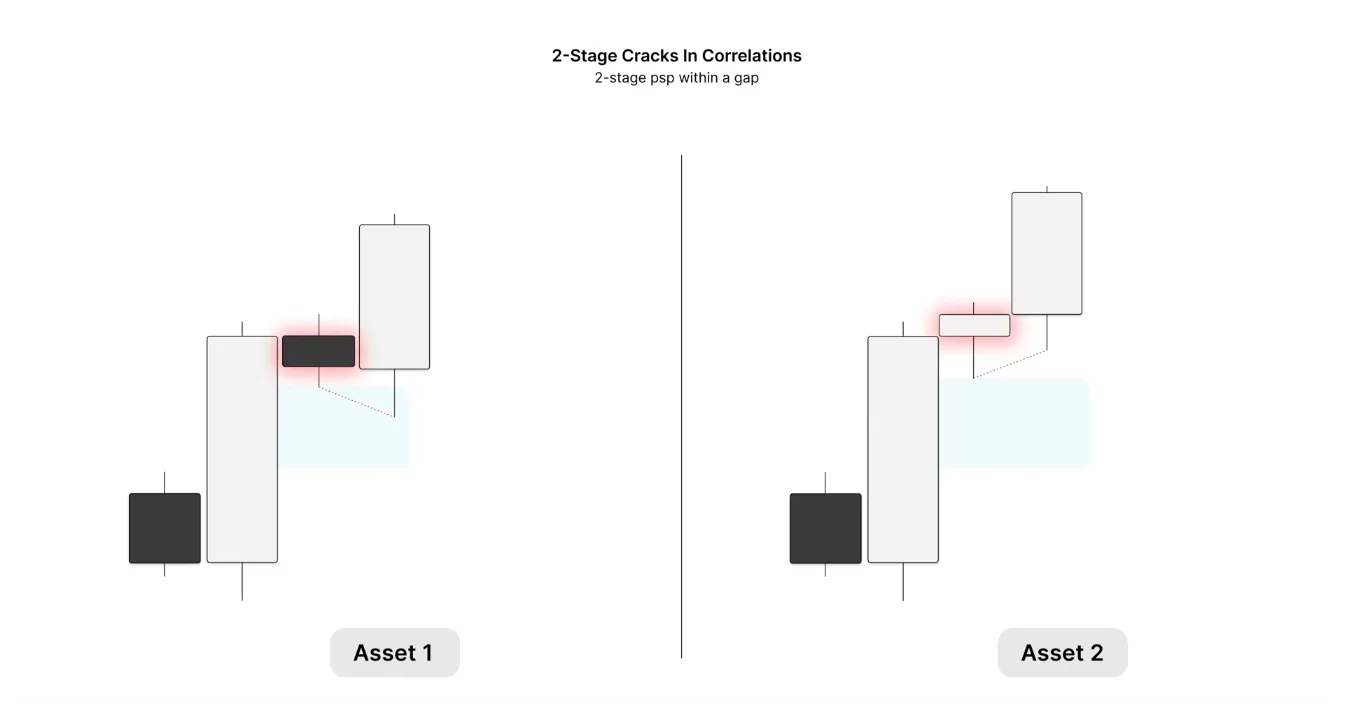
The opposite example is a bearish fair value gap, with a PSP forming the gap's high. Price trades into the gap on asset one while it fails to on asset two, and with that candle being a PSP, we want to see price trade away from the 2-stage SMT fill.
Examples
The chart examples were all live-conducted examples, so please refer to 7:06 in the YouTube video accessible on the right-hand side of this page.
That's the end of this lecture, I hope you found value reading this and you learned something new that you can apply, or further refined your knowledge on this subject.
Back to the top