Introduction
In this lecture I guide you through how to properly filter and time reversals and continuations using SMTs. I walk you through all the different types of SMTs, or cracks in correlation, that I use, and how I actually apply them in my trading.
How To Filter Reversals And Continuations With SMT
SMT Between Swings
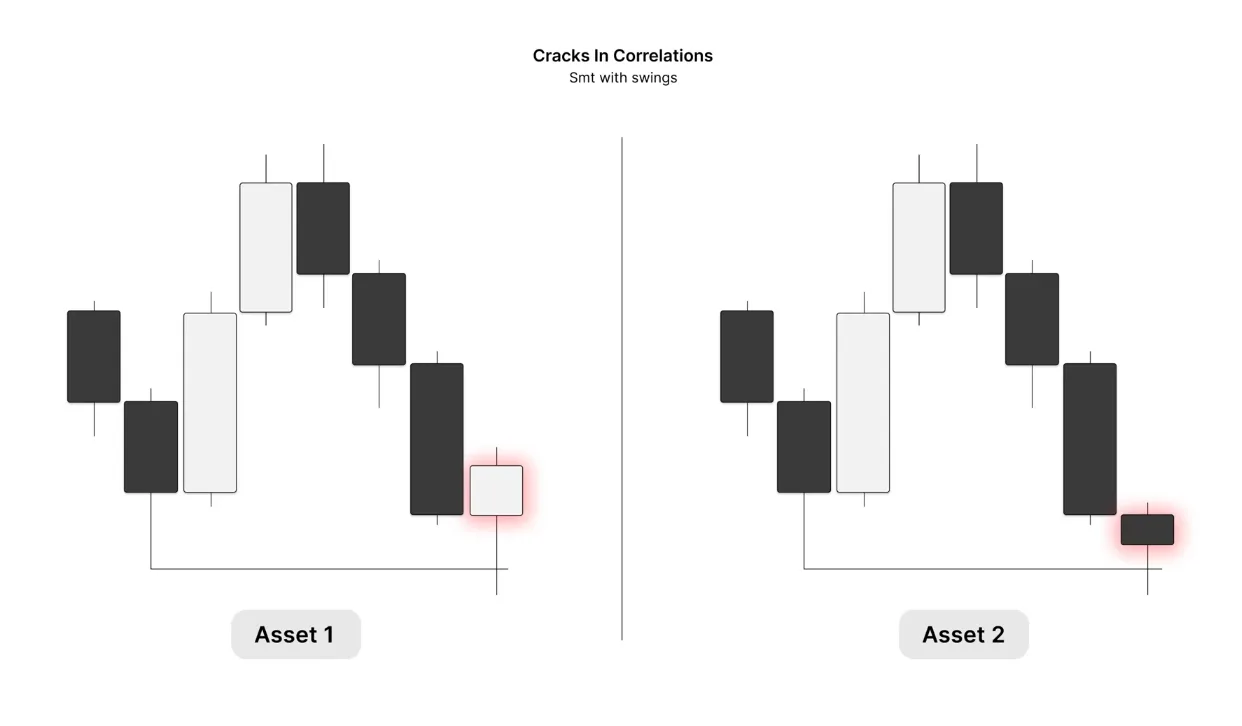
SMT with swings is a very simple topic. If you've read my previous lectures on universal models, you know what swings are. Here asset one comes up and fails to take the high, while asset two comes up and sweeps it. That is SMT with a swing high, the bearish case.
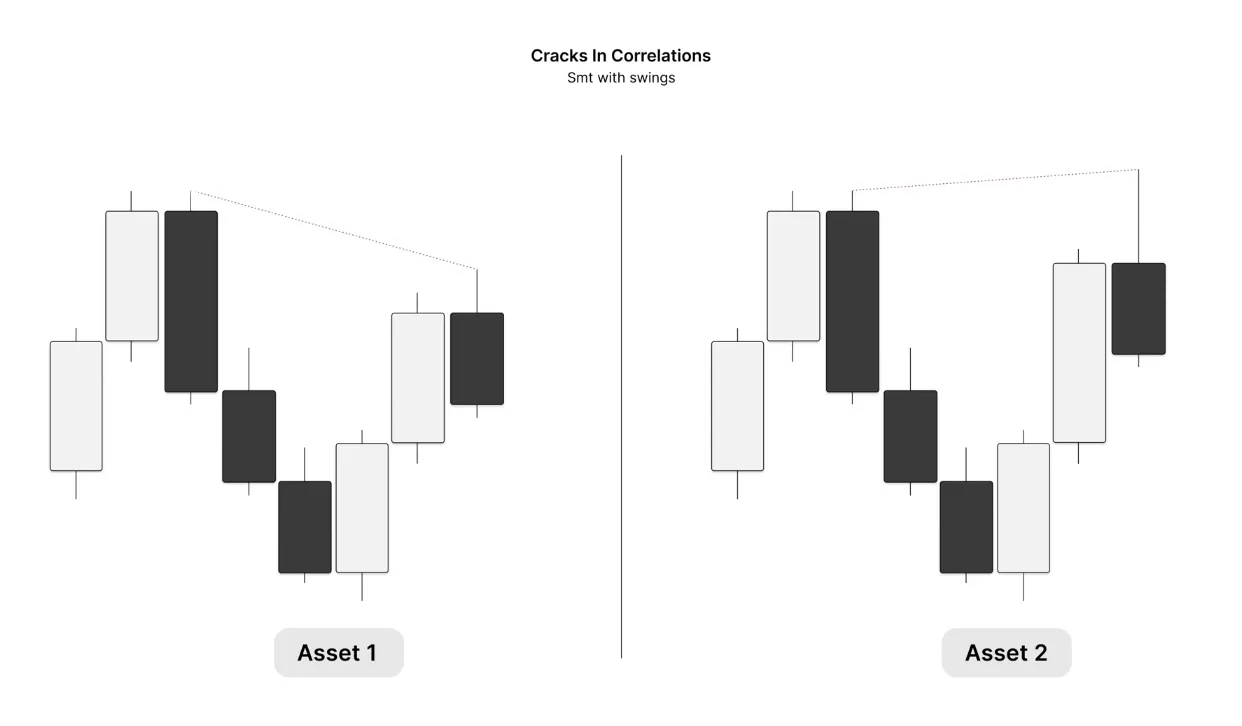
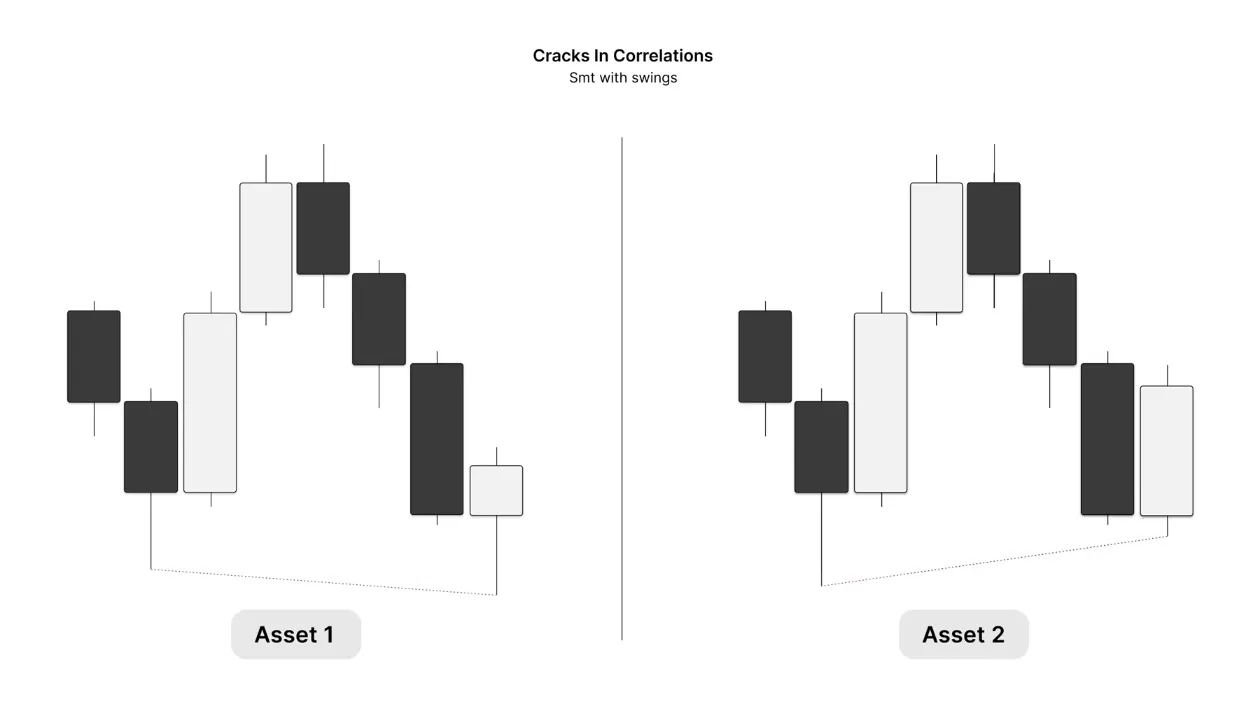
The bullish case is the same in reverse. The swing low does not get swept on asset two, while asset one does take it. That is bullish SMT with a swing low.
Consecutive Candle SMT
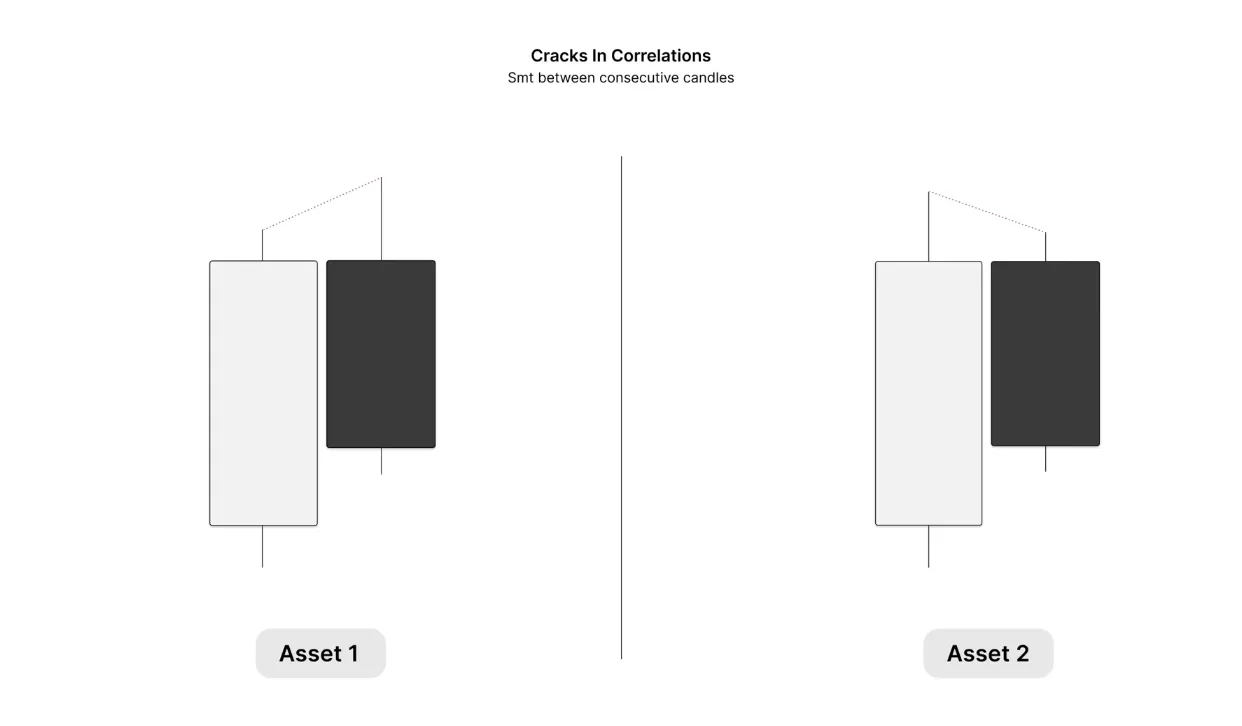
Next is a simple subject: SMT between consecutive candles. This is a form of SMT you can use when price trades into a key level but doesn't give SMT at the key level itself. Instead it gives SMT around it: a Consecutive Candle SMT in a gap, or around a high or a low.
Here asset one sweeps its previous candle's high while asset two fails to sweep its previous candle's high. That is a Consecutive Candle SMT.
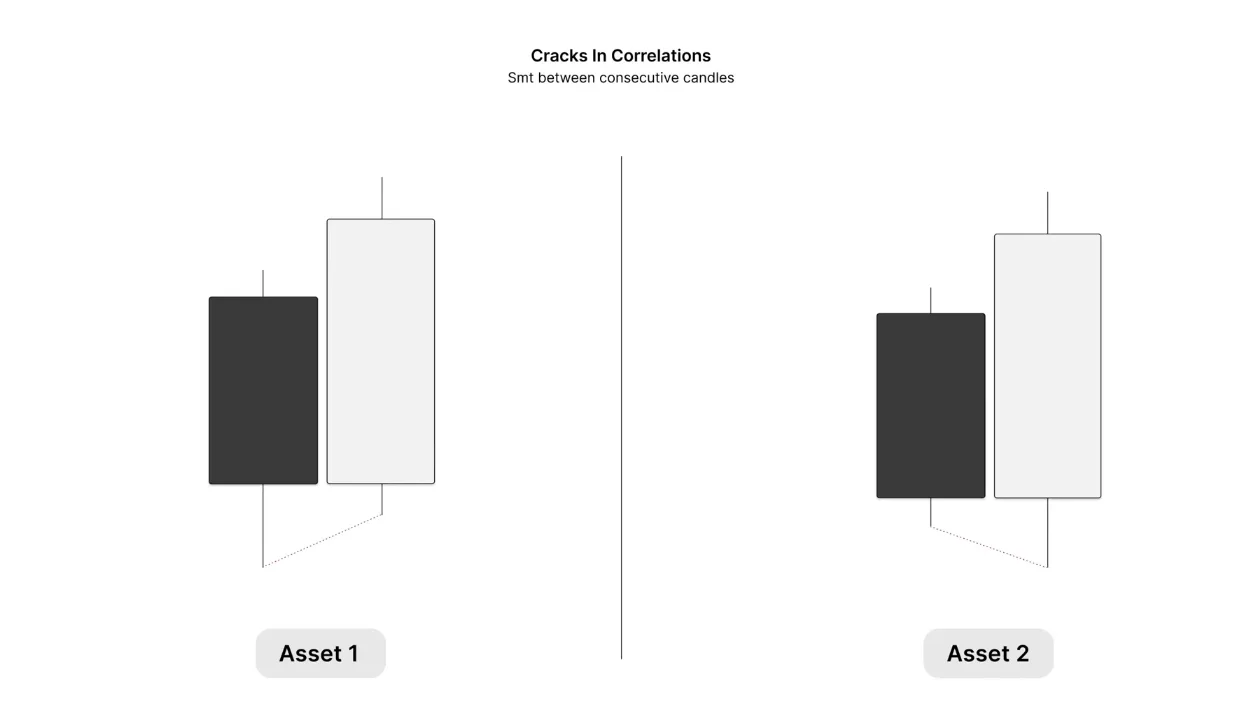
The bullish example is the same in reverse: asset one fails to take the previous candle's low while asset two does take it, again creating bullish SMT.
SMT With Gaps
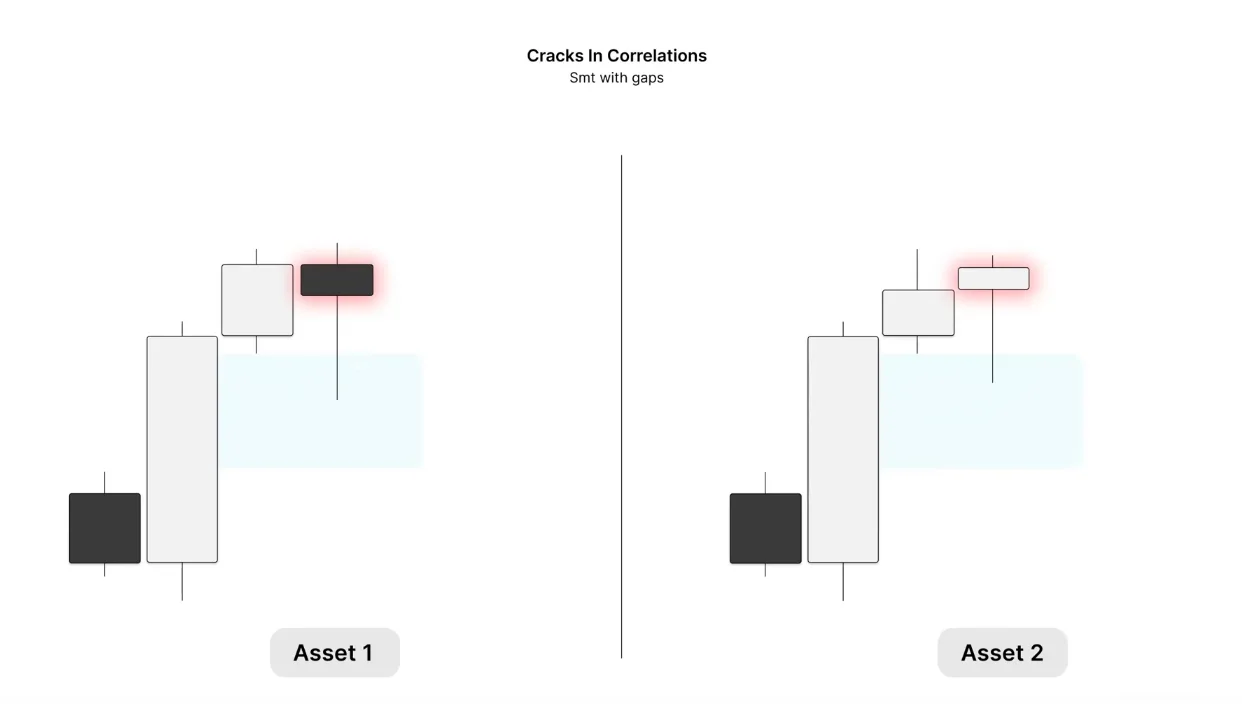
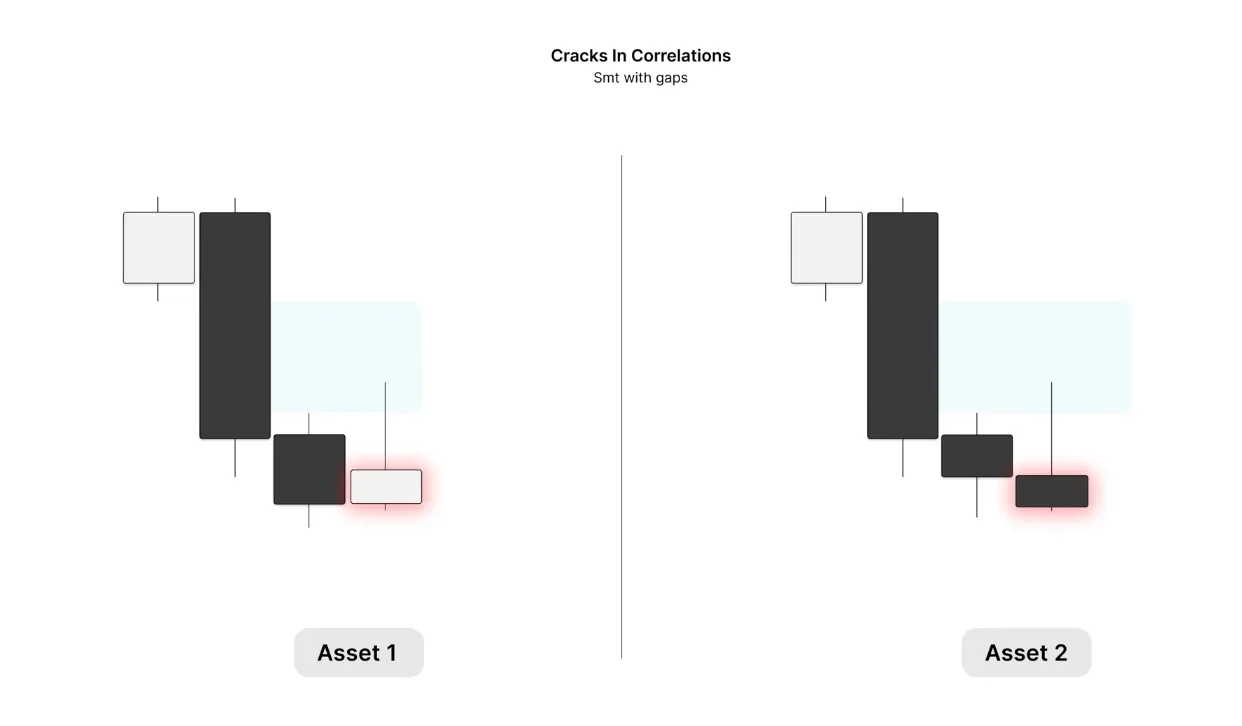
SMT with gaps is one of my favorite signatures to trade. Here asset one trades into the gap and asset two fails to trade into it. Asset one also closes as a C2 closure, which is very important for us to then trade away from that previous candle. So asset one trades into the gap while asset two does not: that is bullish SMT, and now we want to see price expand away from it.
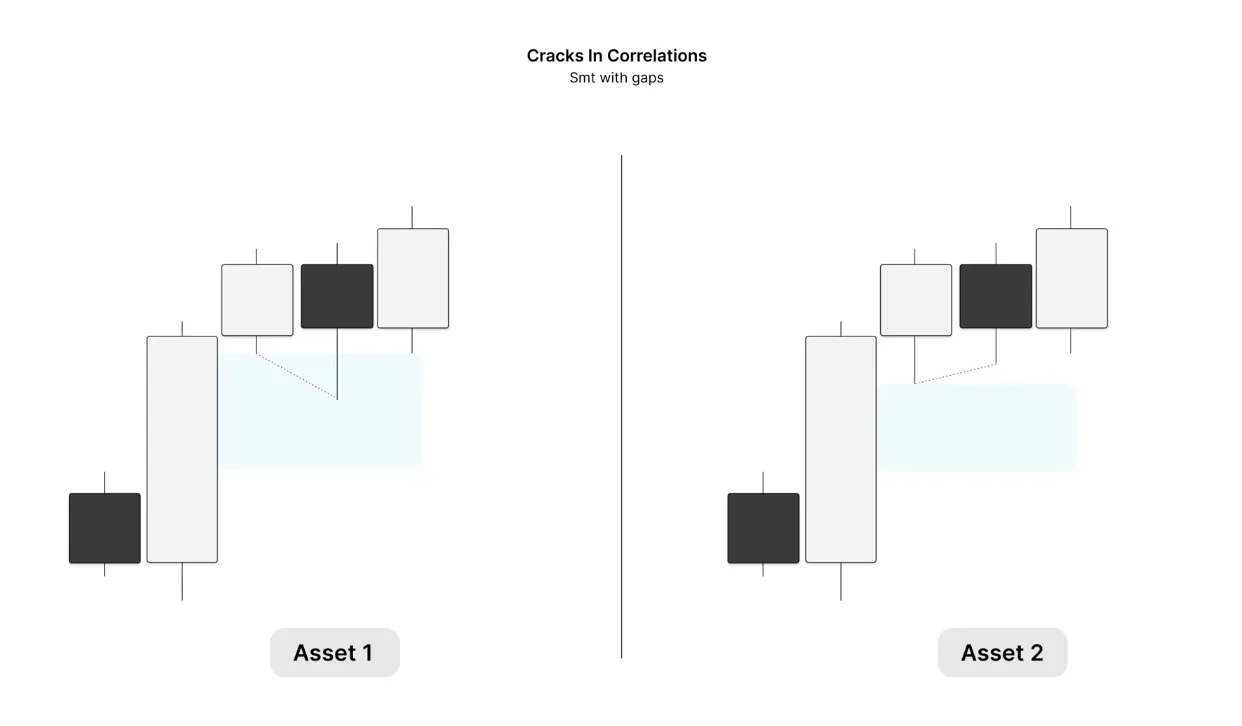
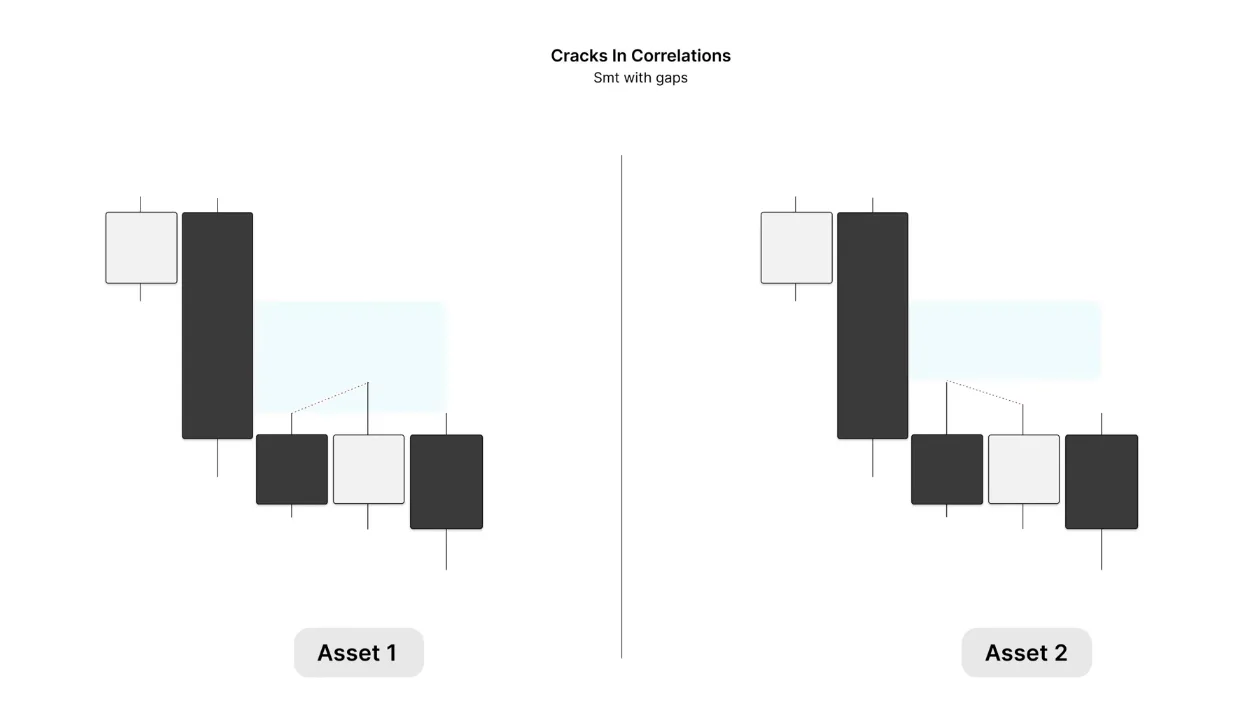
The bearish scenario is the same. Asset one trades into the gap, taking the previous candle's high, while asset two fails to trade into the gap and makes a lower high. That is a form of bearish SMT.
Learning it alone isn’t easy...
Learn The Lathyrus Model with direct guidance from our coaches.
- 10 live streams every week
- Regularly updated in-depth course
- 450+ hours of live stream recordings
+ more
Precision Swing Points
A different form of SMT that many of you may not be familiar with is the Precision Swing Point, or PSP, and this is how I apply it in my trading.
Here asset one and asset two close as two different colored candles. A PSP is when the same candle, at the same time, closes as a different color on the correlated assets. For example, the 10 a.m. 4-hour candle on asset one closes as a down-close candle, and the 10 a.m. 4-hour candle on asset two closes as an up-close candle. That is a PSP.
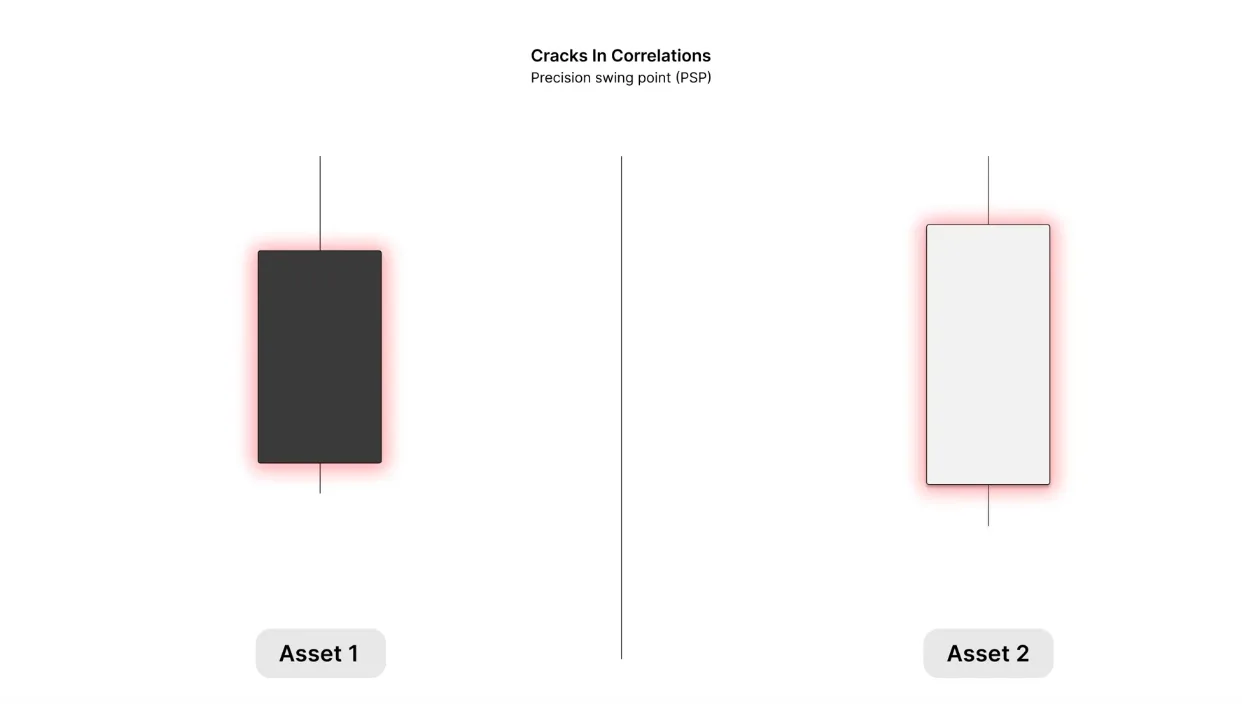
We do not use PSPs in a singular context. They have to be applied using key levels, as we covered in the universal models lectures.
This is how we filter PSPs. Both assets sweep the high, meaning there is no SMT at the high, so you can't frame a reversal off it just yet. But asset one reverses and forms a down-close candle while asset two fails to reverse and forms an up-close candle: a one-stage crack in correlation, a PSP.
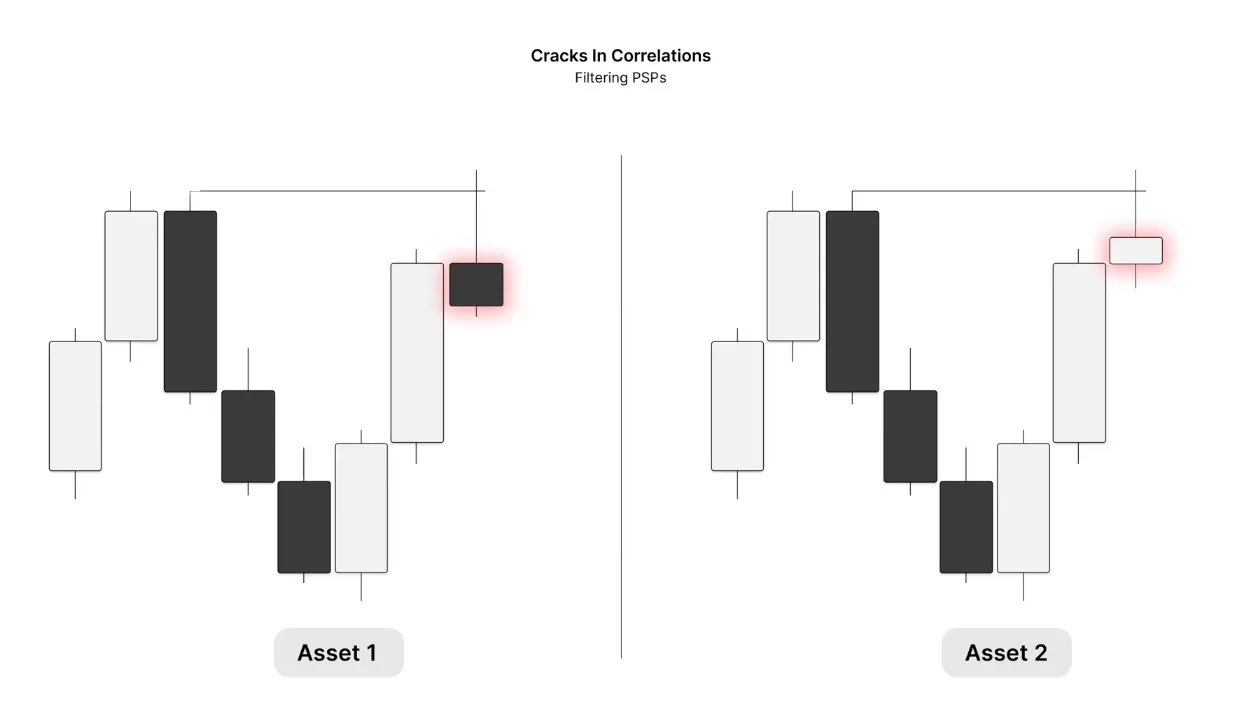
The bullish scenario is the reverse. Both assets take the low, so there is no SMT at it, but asset one closes as an up-close candle and asset two as a down-close candle, forming the PSP, another crack in correlation.
PSPs and gaps. Asset one trades into the gap, and so does asset two. Asset one closes as a down-close candle while asset two closes as an up-close candle: a form of crack in correlation that you want to see price trade away from.
The bearish scenario is the same in reverse: price retraces into the fair value gap on both assets, then asset one closes as a bullish candle while asset two closes as a bearish candle, a form of SMT to trade away from the gap.
Live Examples
One thing before the examples: SMTs cannot be pattern traded. SMTs, or cracks in correlation, are a filtering process within your model. The foundation of your model has to come from universal sequences, key levels, phase of price and profiling. You need to blend all of those together, filter them through cracks in correlation, and use that in your trading.
The chart examples were all live-conducted examples, so please refer to 5:10 in the YouTube video accessible on the right-hand side of this page.
That's the end of this lecture, I hope you found value reading this and you learned something new that you can apply, or further refined your knowledge on this subject.
Back to the top