Introduction
This is the highly anticipated second part of the two-part master class on timing expansions. If you are coming here from Part 1, you have now learned how to accurately identify true reversals in the market, the smart money reversal of a Market Maker Model. Today we talk about how to frame continuations, Candle 3, Candle 4 and so on, into our draws on liquidity once we have identified our true reversals.
If you have not read Part 1, read it before continuing. We are building on those ideas and using that knowledge to better understand how reversals and continuations are framed together, because they are both unique phases of price in market delivery toward draws.
How To Time Expansions In A Continuation
Recap And Continuation
A little recap on the core logic. Similar to the first video on true reversals, the core logic for continuations is quite similar:
- Expansion requires a swing formation.
- Swing formations are Market Maker Models, and Market Maker Models distribute liquidity from internal to external range liquidity in some variant, which we learned as the universal models.
In Part 1 you became an expert at identifying where true reversals, or C2s, form, how to identify their structure with cracks in correlation, and how to confirm them with signatures such as changes in the state of delivery and the V-shape. Today we hone in on trading away from these true reversals and look at the continuation sequences we can also frame. These allow you to trade both the reversal phase of price and the reaccumulation or redistribution phases of price, ultimately making you a master at trading Market Maker Models, able to pioneer any phase of price the market gives you.
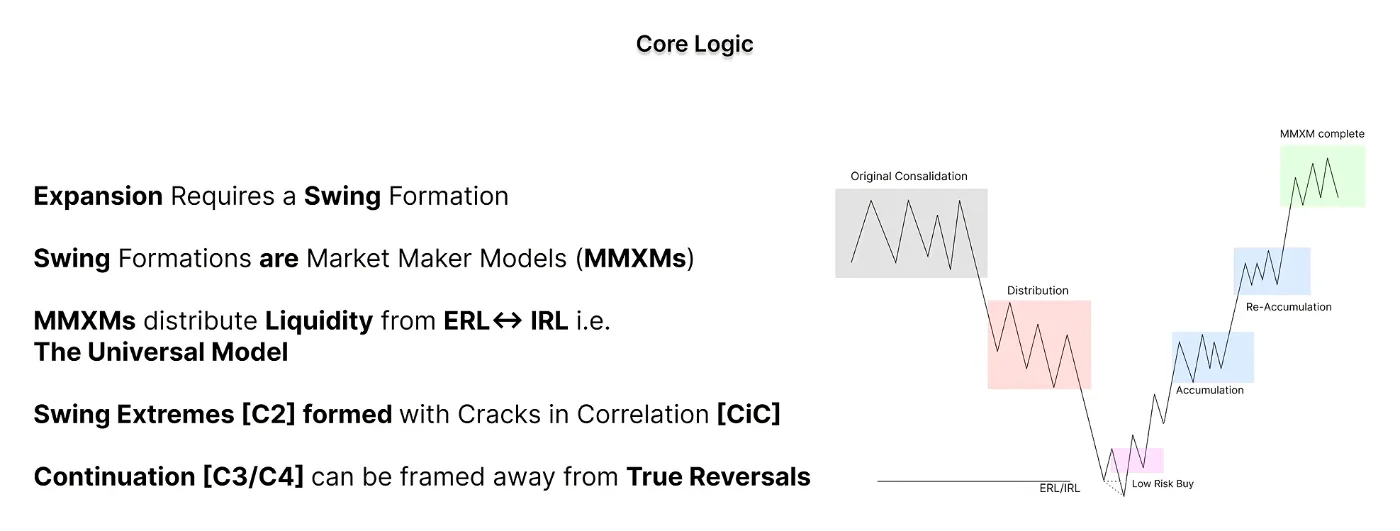
Core Model Application
Let's talk about the universal model, the Market Maker Model applications, and how continuations are framed in the context of our Market Maker Models. Take a generic example and a quick understanding check. As you know from the previous lecture, when a higher time frame key level is engaged and we see our 2-stage crack in correlation variant, you can frame reversals from key levels. This could be on a higher time frame chart like a daily or a 4 hour, all the way down to something like a 15 minute. Then we zoom into that fractal of reversal, where you see the reversal candle we defined as a Candle 2, and then you see continuation away from that reversal candle until the draw is met.
So in the instance that the candle that reverses does not also expand to the opposing side of the range, we use the contents of this lecture to frame and structure how we trade that Candle 3.
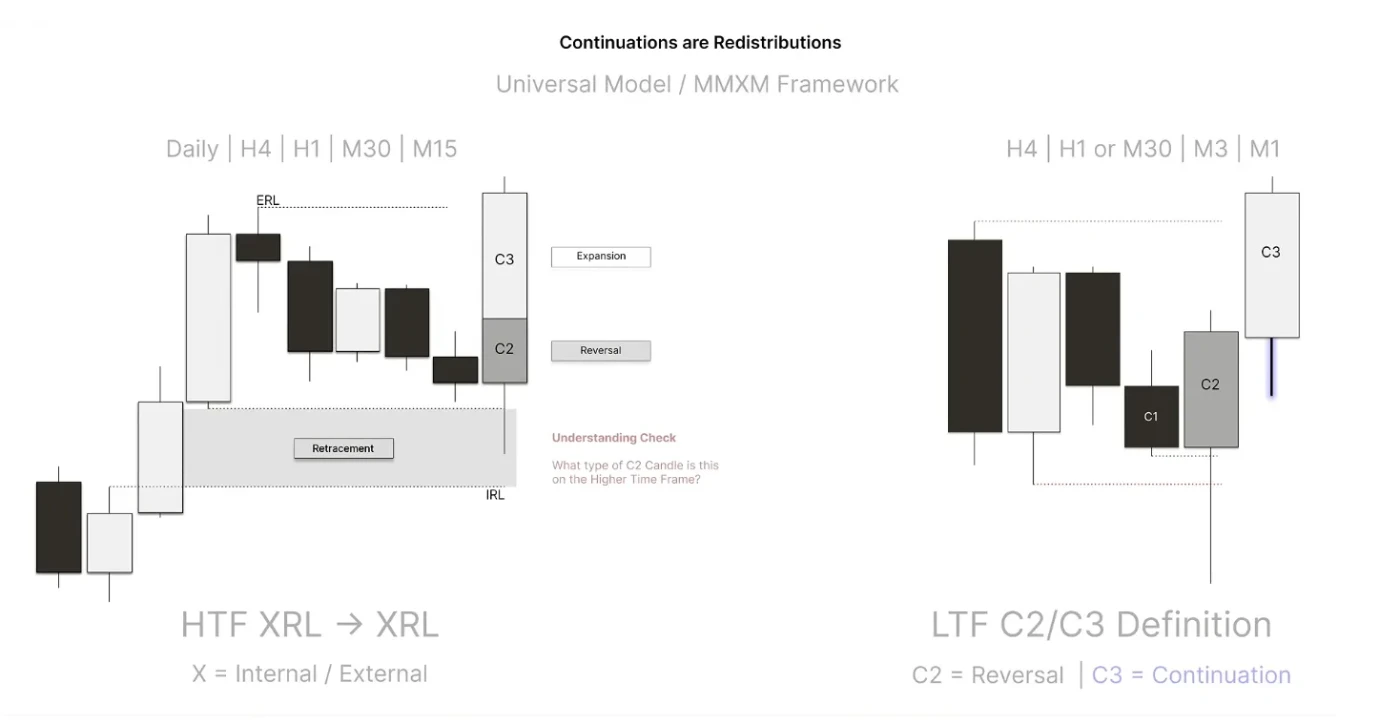
Zoom out a bit more. Any universal fractal, a generic fractal that could be external or internal range liquidity, is generally what we see on the higher time frame and the lower time frame. Each universal fractal, or universal model, is a Market Maker Model. That requires a swing point formation at its reversal and then an expansion into the opposing side of the range, also defined as the original consolidation.
To make sure you are still with me and taking elements from the first video into your understanding: how would we determine if this Candle 2 is a true reversal? Give yourself a minute. That is where we bring in and recall our 2-stage crack in correlation and our divergence logic from the last lecture.
Once we have established a swing point, and the market requires a swing point to reverse, we can look to trade continuations, i.e. the third and potentially fourth candle, toward the draws on liquidity: short-term highs, and external range highs or lows on the opposing side of the market. That is what we focus on today, this Candle 3 and the dynamics that exist in it. You have already learned how the Candle 2 forms.
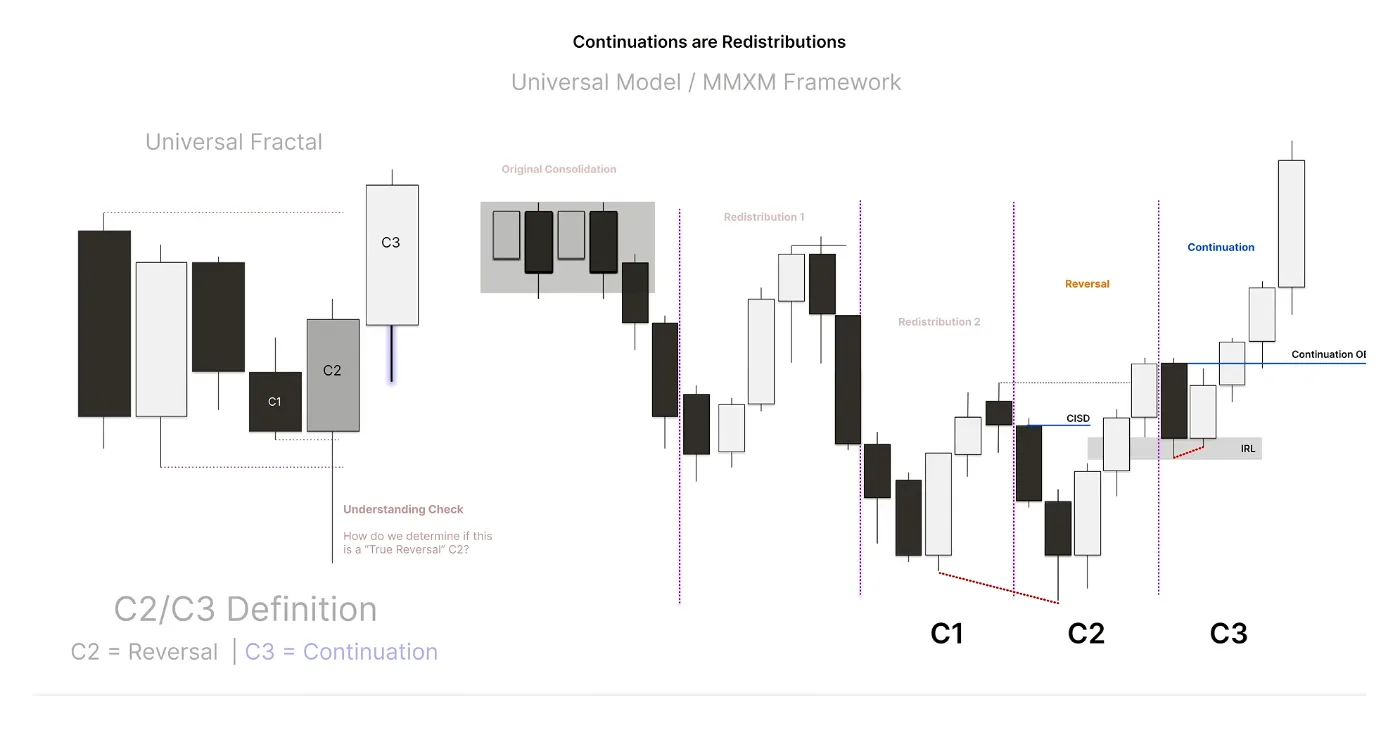
2-Stage Crack In Correlation
What defines a true reversal? The 2-stage crack in correlation. If you have not read Part 1, I highly suggest you read it before continuing. For a quick recap, here are the 2-stage variants for a true reversal:
- PSP confirms SMT. A Precision Swing Point confirming an SMT inside a key level of our universal model, followed by the V-shaped displacement and then ultimate continuation. We get a crack in correlation of a key level with divergence, and then we confirm the swing via a PSP.
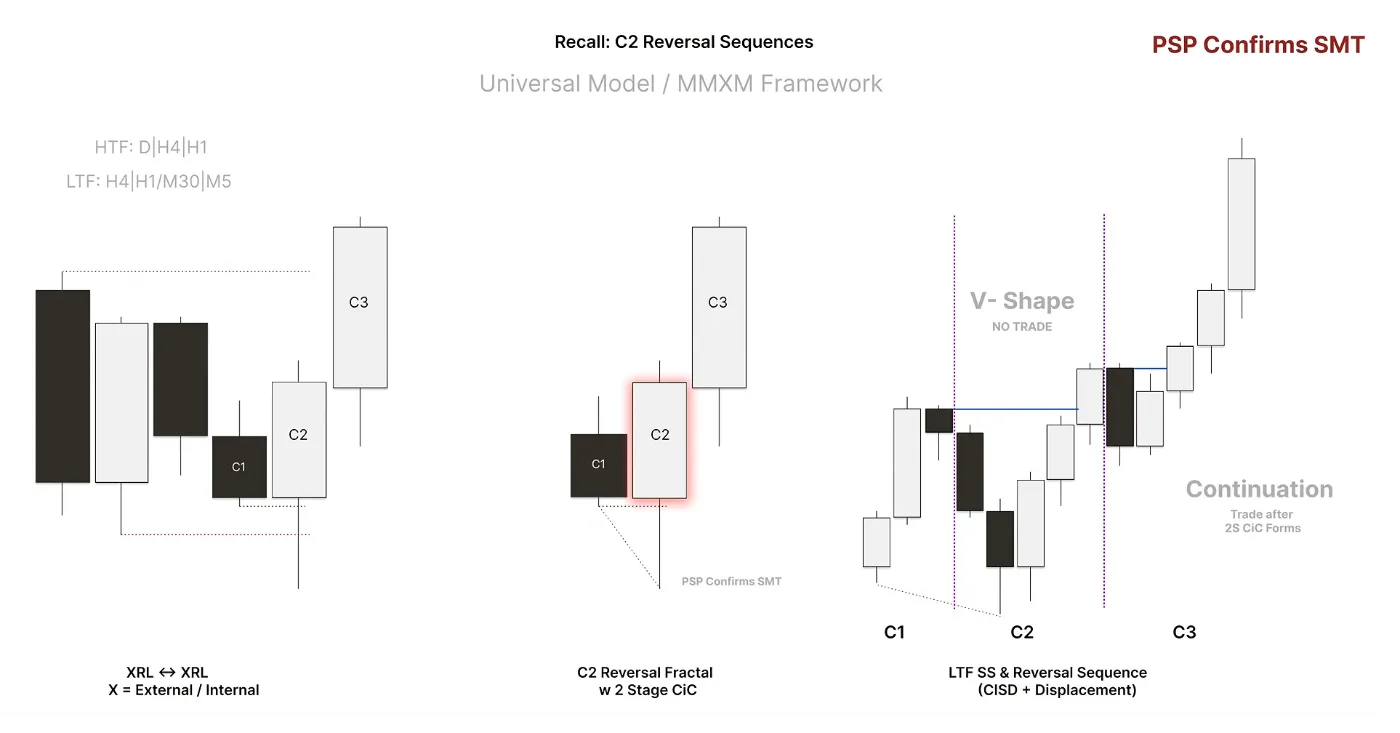
Recall: PSP confirms SMT. No trade in the V-shape; the continuation is traded after the 2-stage crack forms. - SMT confirms PSP. The inverse: a key level, and an SMT confirms that a PSP right at that key level will hold. Again confirmed by the V-shaped displacement in that Candle 2.
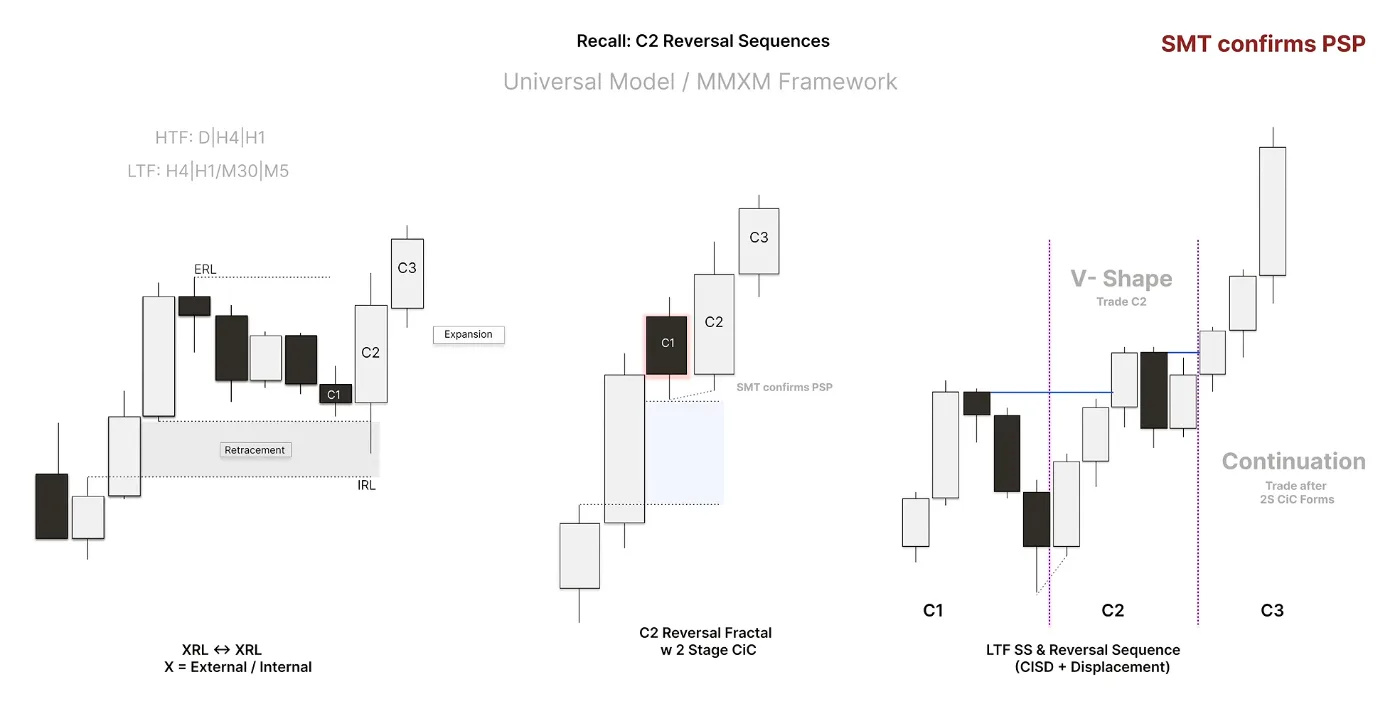
Recall: SMT confirms PSP. C2 is traded in the V-shape. - 2-stage SMT. We trade into a key level, external or internal range liquidity, and frame a reversal off that key level via a 2-stage SMT inside the key level, with that characteristic V-shape.
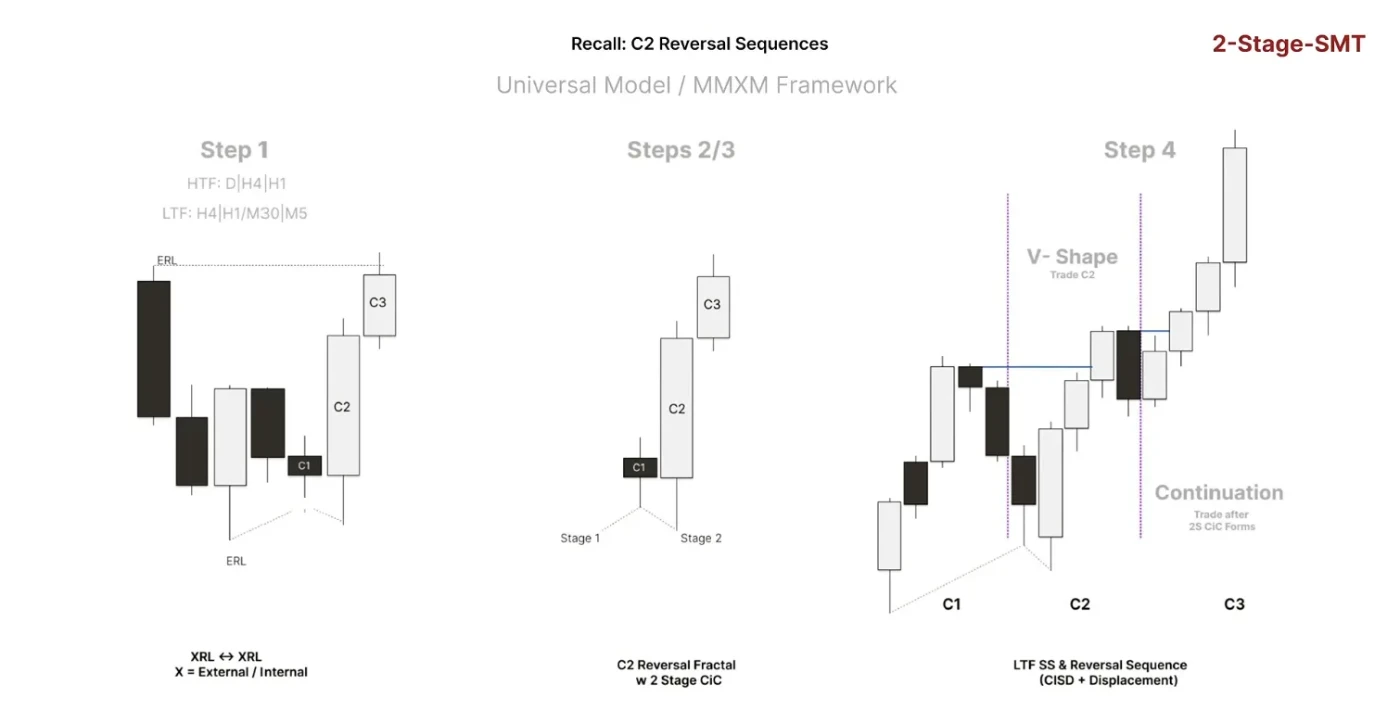
Recall: the 2-stage SMT, stage one and stage two at the key level. C2 is traded in the V-shape.
These are important for understanding true reversals, and we also incorporate some of this logic into continuations. I hope that is exceptionally clear at this point.
Learning it alone isn’t easy...
Learn The Lathyrus Model with direct guidance from our coaches.
- 10 live streams every week
- Regularly updated in-depth course
- 450+ hours of live stream recordings
+ more
Swing Invalidations
Before we get into sequences, let's talk about swing invalidations. What are the invalidations for this Candle 3 continuation, where would we say the Candle 3 is unlikely to hold, and where could it potentially fail? We are going to look at a series of mechanical filters for continuation. If you use these filters when trading, you will get on side with high probability expansion candles that form continuation. In the case that these invalidations are met, meaning price does not support expansion, these mechanical filters keep you out of price when it is unlikely to form high probability continuations.
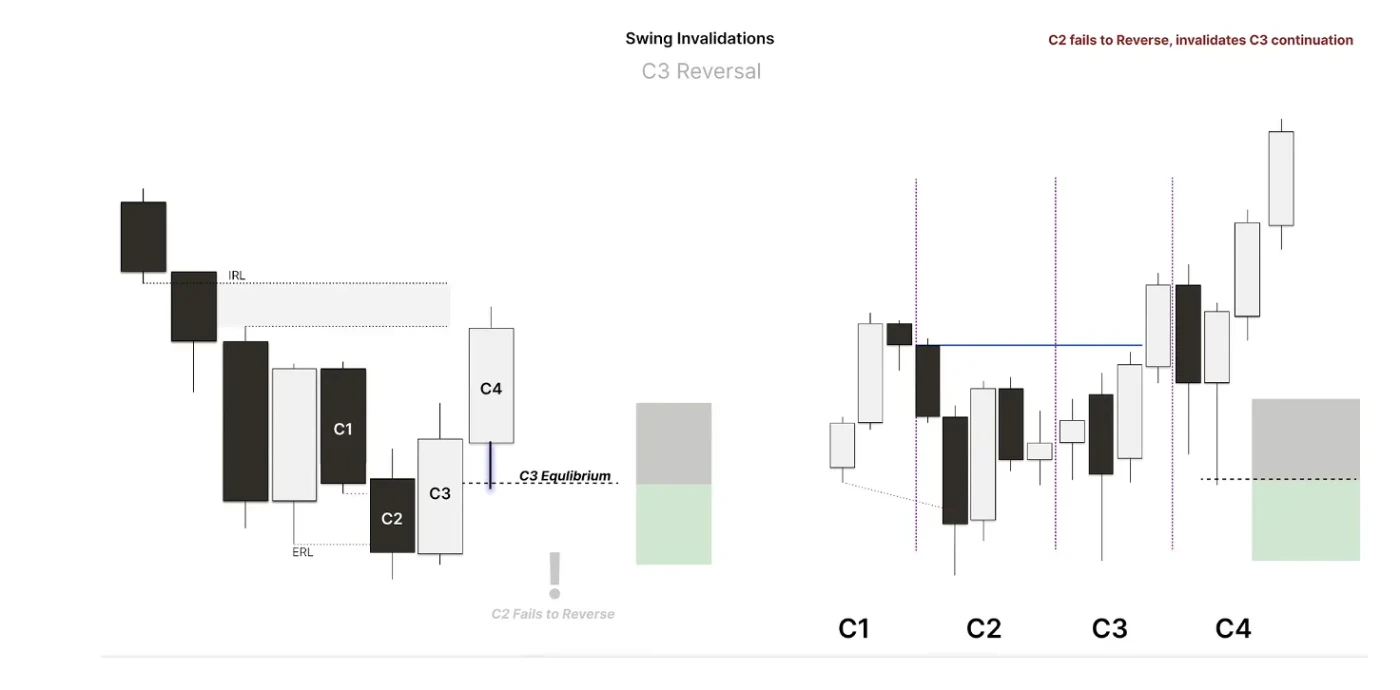
The equilibrium of Candle 2. If we have a generic reversal in a universal model, meaning at the Candle 2 low we have a 2-stage crack in correlation in a key level, we expect Candle 3 to stay in respect of the upper half of Candle 2. We will look specifically at which PD arrays inside the upper half of Candle 2 we expect to hold, but generically speaking we use an equilibrium invalidation. That means Candle 3 should form a small opposing run in the upper half of Candle 2 before expanding. If it forms a large wick into a deep discount of Candle 2, it is unlikely to be a high probability expansion candle for continuation.
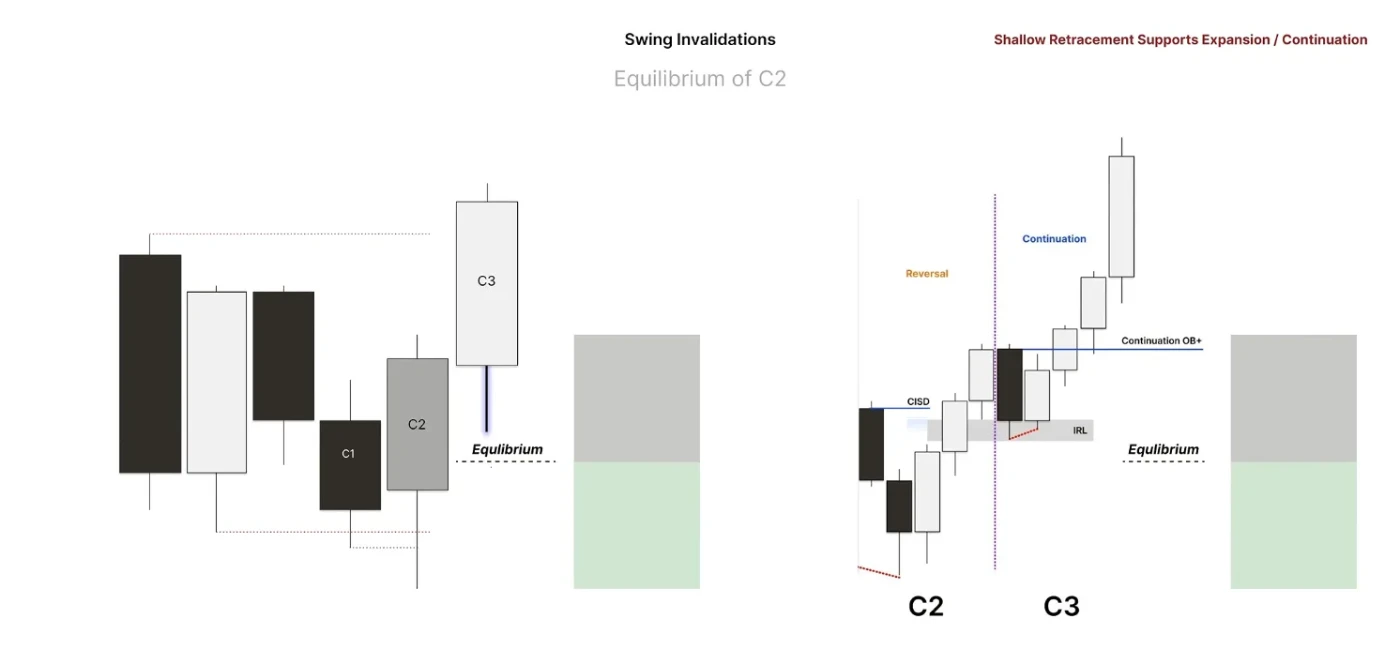
When we have a deep retracement of Candle 3 that extends far past the equilibrium of Candle 2, we extend this logic into the subsequent candle, Candle 4, and look for that candle to support expansion with a small opposing run and then a V-shaped confirmation. So when we see a deep retracement of Candle 3, we do not look to engage Candle 3 as an expansion candle for continuation toward our draw. Instead we wait for the next candle to open, stay in respect of the equilibrium of Candle 2, from the low to the high, and then expand toward the draw.
To sum up, for your notes: if we see deep retracements of Candle 3 as a continuation, we invalidate the idea of expansion and look to trade the next higher time frame candle's open with that smaller opposing run or wick. An ideal continuation sees the candle stay in respect of equilibrium.
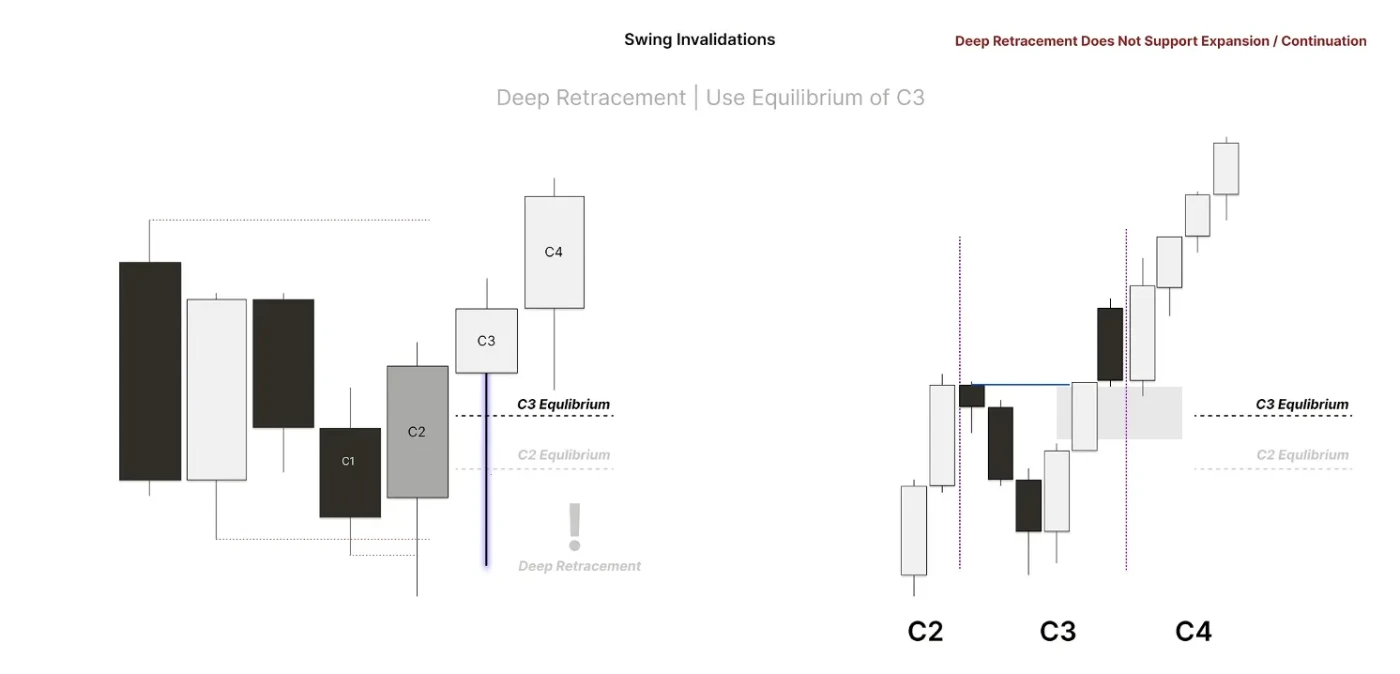
The C3 reversal. In the instance that we get a Candle 3 closure, meaning C2 fails to reverse, as we covered in the first part of this master class, we look for that Candle 3 to close above the opening price of Candle 2. Then we extend the continuation logic to Candle 4 staying in respect of C3's equilibrium, forming that smaller opposing run into a key level and then expanding away toward the draw on liquidity for the universal model. So the C3 reversal invalidation is also that smaller opposing run and equilibrium. Remember, small wicks support expansion, and swing formations that support expansion see continuations not offering deep retracements.
New Phase Of Price
What about a swing invalidation that is a new phase of price? This is extremely important when considering the dynamics of a price move in the market. Say we have a universal model where the market is engaging a key internal range of liquidity and reversing to expand toward an external range draw. As we know, the market exists in a fractal nature. That is to say, many times price will engage relevant swings in the market, forming new phases of price, before expanding once again.
So when we see price in a universal fractal trade into a key opposing level, say on a daily chart we see price trading into a key daily or 4 hour high, we would not want to blindly pattern-trade a continuation through that high without first confirming a new phase of price. Often, as price engages key levels, and we now refer to these key levels as relevant swings, we confirm a continuation through that high via an understanding of the phase of price.
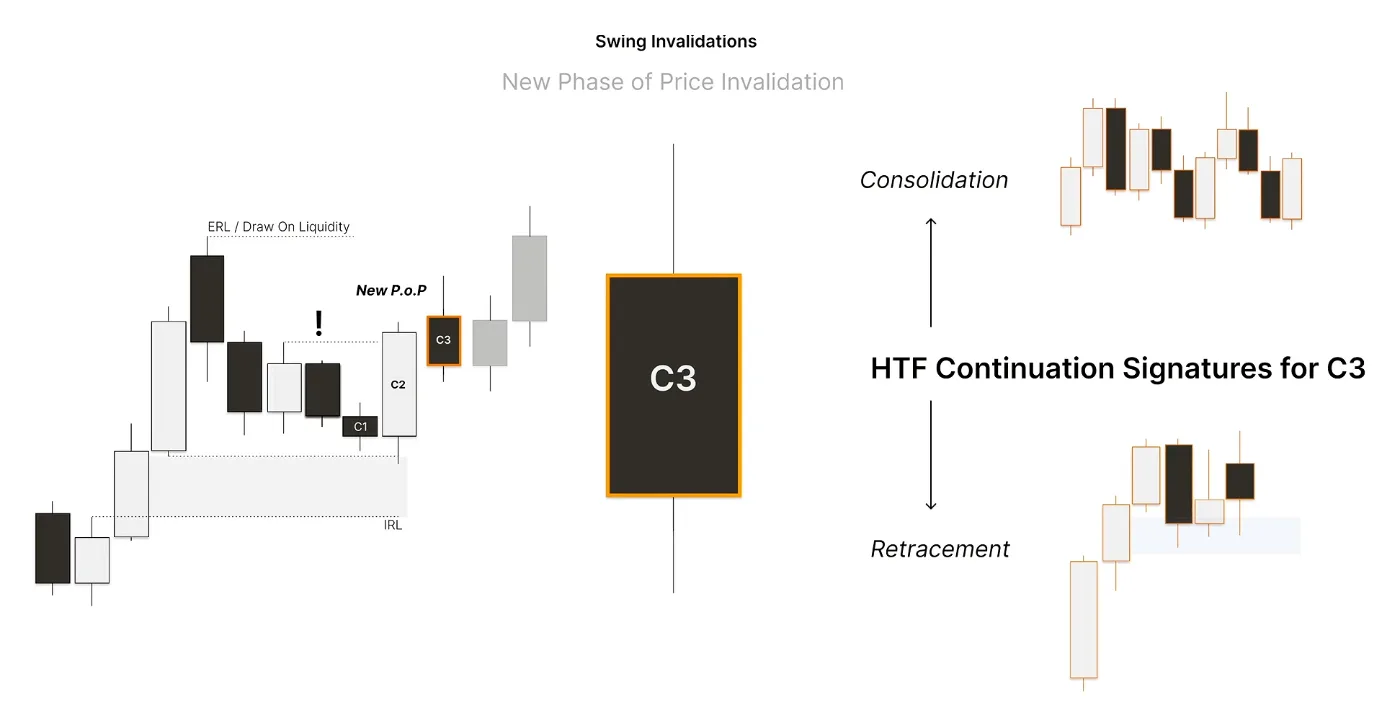
These are generic continuation signatures for a Candle 3 that does not reverse after engaging a relevant swing. To recap: as we move from a key internal range of liquidity to external range liquidity, or more generically from one higher time frame universal model level to another, we can expect new phases of price to form at intermediate swings before the draw on liquidity is met. These can look like consolidations or retracements, both of which support higher time frame continuation toward our ultimate draw on liquidity, the opposing side of the range.
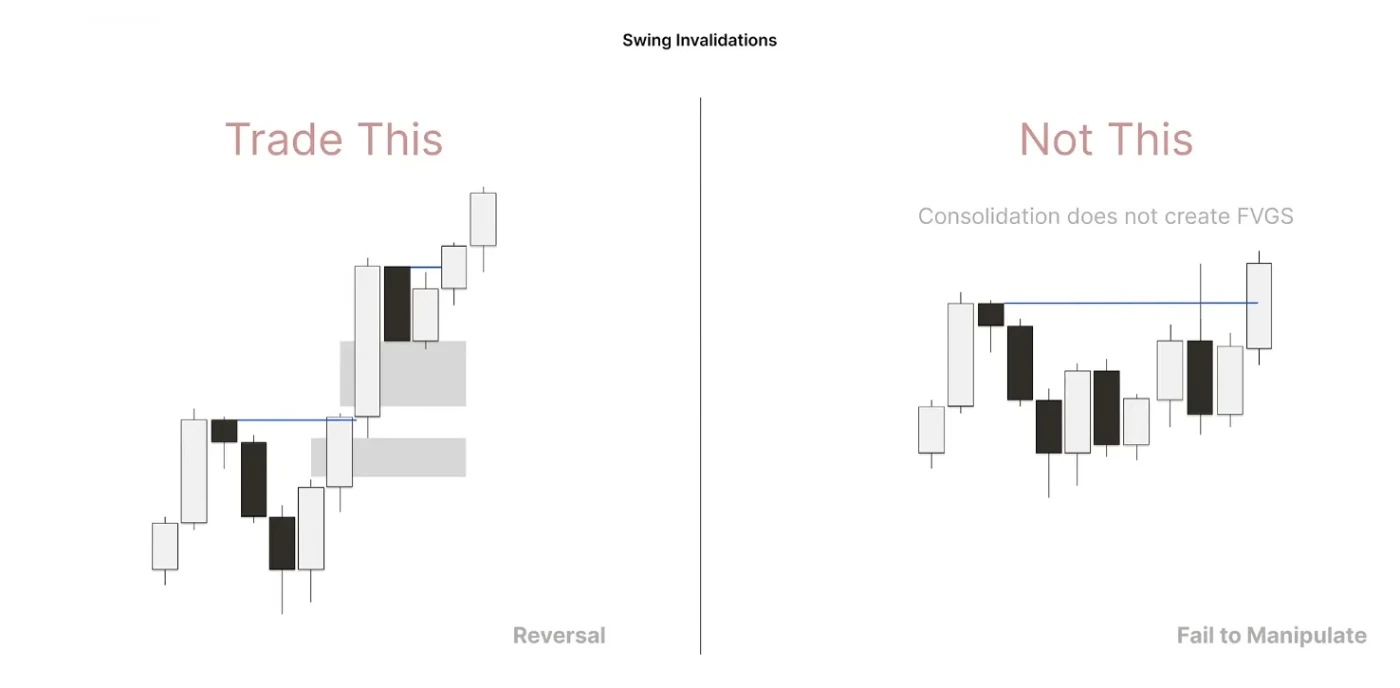
This sums up what a swing invalidation looks like from the standpoint of a lower time frame signature. If we trade a reversal into expansion, a reversal followed by continuations higher, we want to trade clean market movements that show displacement, institutional involvement, followed by continuation, which is strong closure through opposing candles. If your CISD in a continuation, or even a reversal for that matter, looks choppy, do not trade that fractal. We want to avoid trading consolidation and instead trade strong expansion signatures in the market.
So if you see your Candle 3 start to form a consolidation or retracement signature, first ask yourself: are we trading into a key level in the market, a relevant swing? If we are, in this Candle 3 we do not want to trade a consolidation change in state of delivery for continuation. Instead we allow that new phase of price to hold as a new invalidation, and then trade a subsequent swing formation that gives us a strong reversal signature on the lower time frame. Remember, the continuation also shows us these reversal signatures, the changes in state of delivery and the displacements.
Continuation Frameworks
Now that you understand where continuation lies within the spectrum of a Market Maker Model, from one key level to another, let's look at the variants and the framework we apply to trading these Candle 3 and Candle 4 continuations.
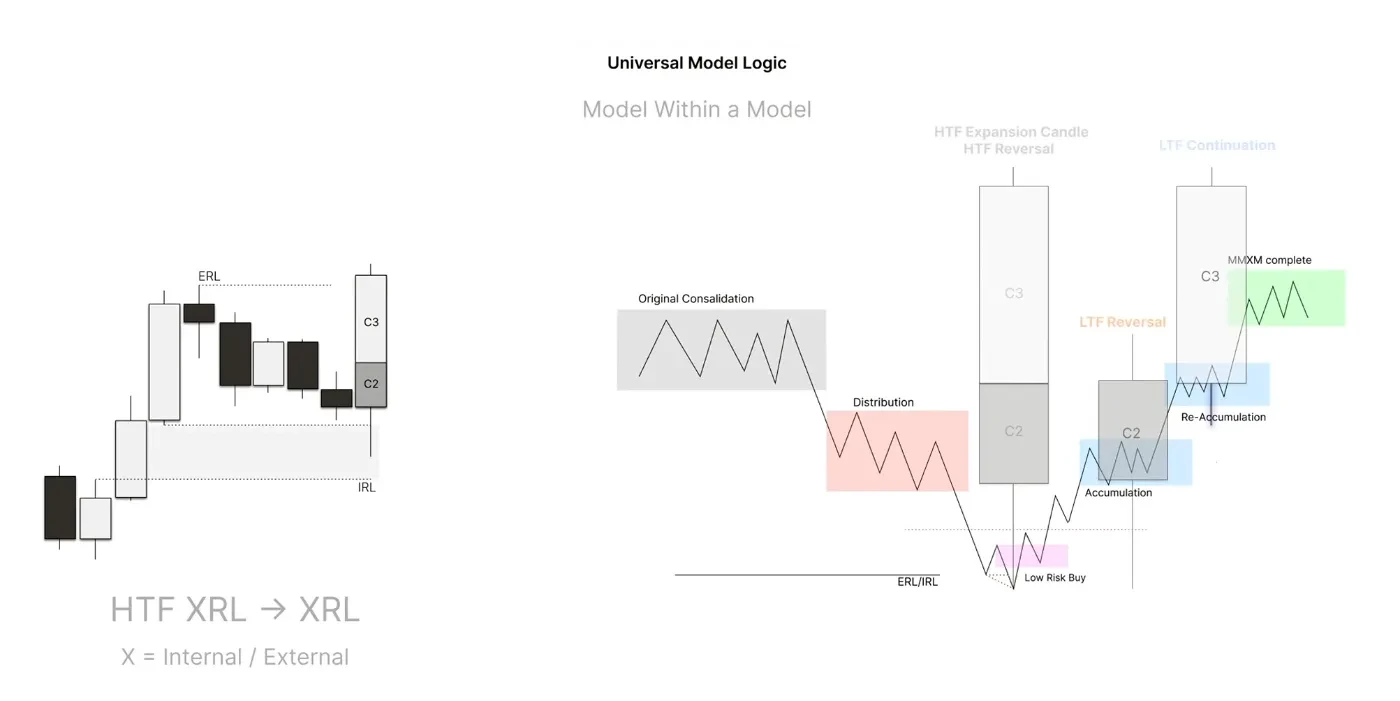
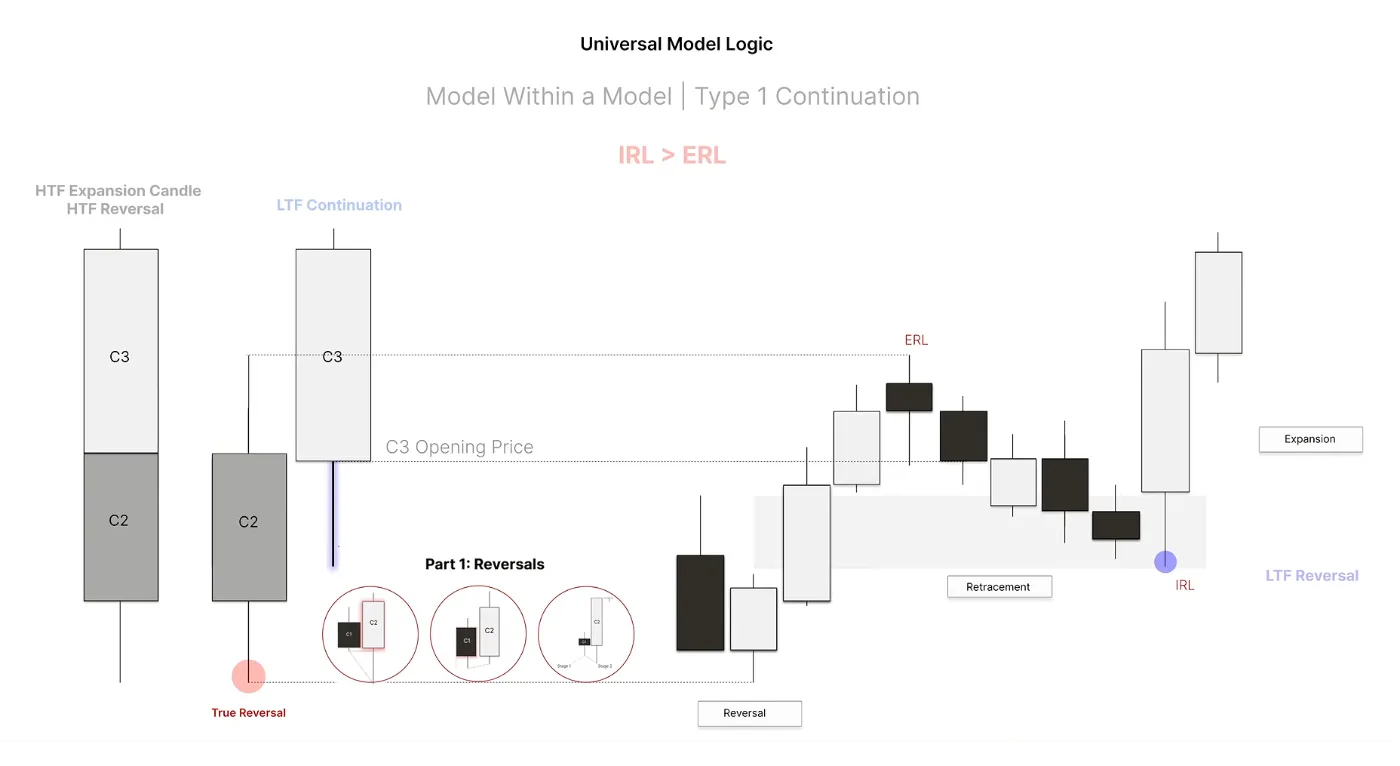
Here is a generic schematic of what our continuation now looks like with the Market Maker Model idea superimposed on top. We have some universal fractal. We call this a model within a model. We are trading from one IRL or ERL to the other side of the range, XRL to XRL, where X is internal or external range liquidity. In the context of a Market Maker Model, the opposing side of the range offers our original consolidation, draws liquidity, and the Candle 2 reversal forms at the wick extreme. Then we see continuations on the higher time frame, Candle 3 and maybe Candle 4, toward that draw.
So every time we look to frame a lower time frame continuation, we are in fact trading a model within a model. We trade away from a true reversal on the higher time frame and structure our entry around a lower time frame universal model in the continuation candle. From this schematic, what I want you to gain is that the wick of this continuation candle, the reaccumulation of the continuation candle, is itself a universal model on some lower time frame. What follows are the two principal frameworks that lower time frame model can take.
You’ve probably got some questions...
Learn The Lathyrus Model with direct guidance from our coaches.
- 10 live streams every week
- Regularly updated in-depth course
- 450+ hours of live stream recordings
+ more
Type 1 And 2 Continuations
What is the first type of model within a model, i.e. where will the wick of C3 form in the context of this Market Maker Model? The first is a simple internal to external range liquidity variant of a continuation. I am going to dub this a Type 1 continuation, and it is the highest probability continuation. Why? Because we are creating gaps away from the true reversal, and we are opening into the context of a displacement of the previous candle's range.
If you go back to part one you can define how we understand this true reversal to hold, based on the 2-stage cracks in correlation and key levels. Then C3 opens, trades with a wick that respects the EQ of C2 into a key level in the upper half of Candle 2, in this case a fair value gap, and that wick itself forms an internal to external range model, with the higher time frame draw still intact. This is ideal because we are generating a low resistance liquidity signature, a failure swing, to our higher time frame objective from this lower time frame universal model. We are trading internal to external on the lower time frame while the higher time frame is also in an expansion toward an old high or an old low. It is a very high probability sequence that you can get on side with.
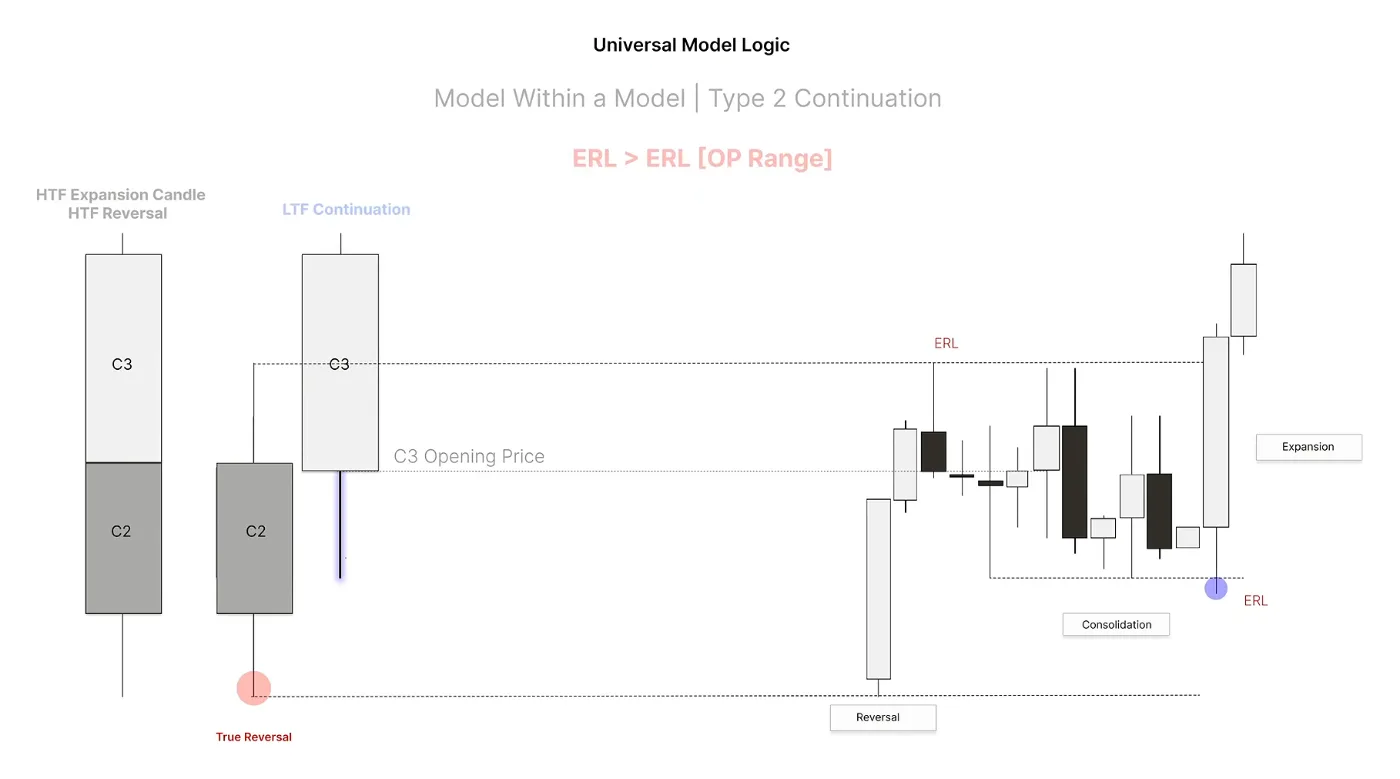
The second sequence, a Type 2 continuation, is similar to an internal to external range liquidity, but it observes Candle 3 trading into a relevant low of Candle 2. After a true reversal is defined from a key level, we see Candle 2 expand and then consolidate, forming the wick. The difference from the previous signature is that there, Candle 2 did not consolidate into its higher time frame close; it retraced, forming the gap. Here we get expansion into consolidation, which, as we said, is a continuation signature. Recall the earlier slide: both retracement into a gap and consolidation following expansion support expansion, or continuation, higher.
So this second case sees us reverse, then consolidate, and if price does not expand away from the relevant swing it creates, we can now expect price to engage that key level, in the form of external range liquidity, and expand away from it. A good rule of thumb: when price retraces into a gap, for example, and does not expand away, that low or high becomes a key level of the market that price can reverse off. This is known as engineering a swing to reverse off, because we are not going to come back into the true reversal low. We engineer a swing, we order pair that range, and we trade from external to external on the lower time frame, again the model within a model, as expansion toward the higher time frame objective.
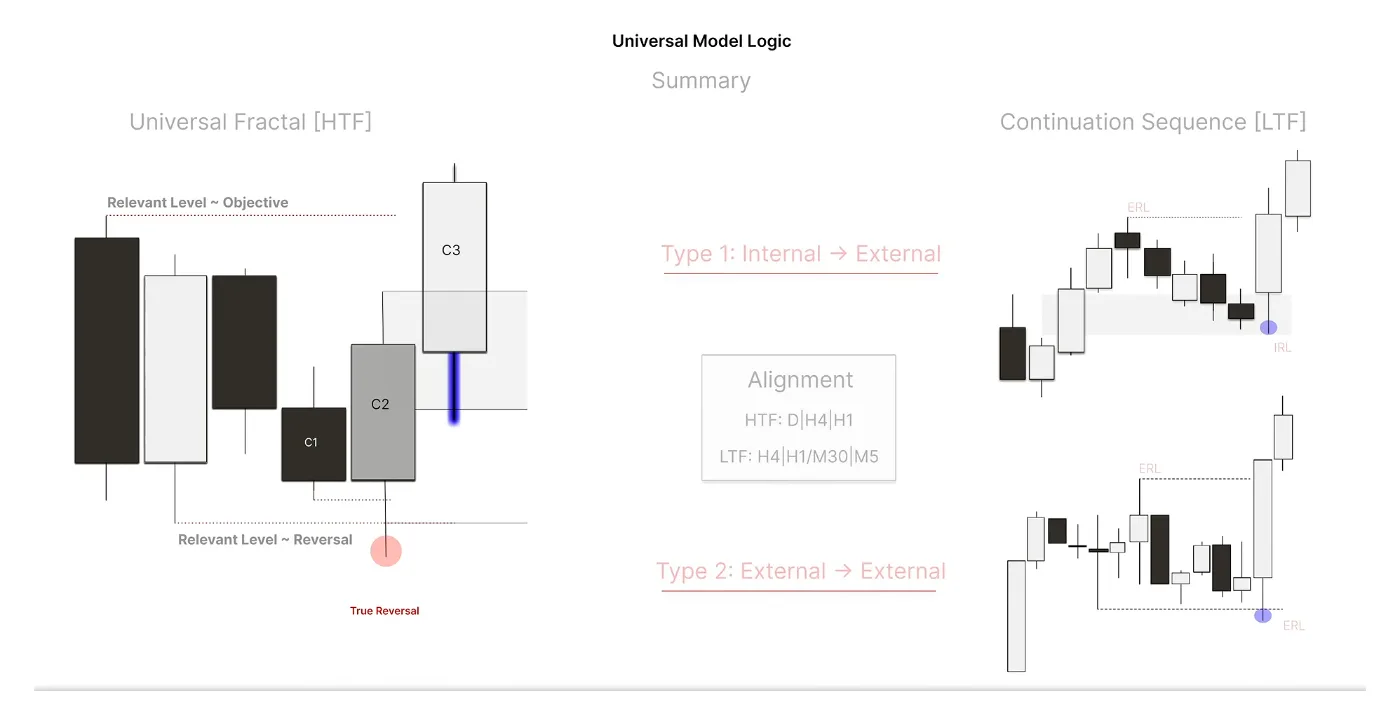
Here is the summary. We have a universal fractal on the higher time frame, a relevant level we frame a reversal off, whether an external low or an internal range of liquidity, and we trade from one relevant level toward the other side of the range, our objective. To get to that objective we form a reversal candle, the true reversal logic from the first lecture. Then, in the context of continuation, you frame these sequences: either Candle 3 opens into a gap in the upper half of Candle 2, or Candle 3 opens into an order paired range, a consolidation function of Candle 2. Both support continuation higher, and those become the universal models of the lower time frame that we trade.
I have even given you your alignments. If we have a higher time frame daily Candle 2 closure, we look for this continuation sequence to form the low of the next day's candle on, potentially, the 4 hour. Likewise for the 4 hour and the 1 hour. It is all fractal, so go and look at all the time frame alignments. This is a generic structure: Candle 3 opens up, regardless of the time frame, and forms a universal model to continue as a sequence higher.
Qualifying Swings
Now let's use our crack in correlation logic, the same logic I have taught you extensively, to frame the highest probability continuation sequences in the market. We qualify our swings with crack in correlation variants within gaps. This could also apply to order paired ranges, but as I mentioned, the highest probability continuation sequence is your Type 1, IRL to ERL, because it shows the market has displaced and created fair value gaps. That is the continuation sequence we focus on for the rest of the video. There are three types of sequence.
- A crack in correlation at a key level, meaning at a gap. We have a true reversal of correlated assets. This could be the S&P, the NASDAQ and the Dow, any triad, gold and silver, or crude oil, HO and RB, any correlated assets. As we expand away from a true reversal Candle 2, we create a gap that Candle 3 opens into and forms its low in. That wick is formed via a crack in correlation at the gap, where we form an SMT to create a swing point. This is where SMT confirms a swing in a gap.
- A crack in correlation in the key level itself, a swing point closure. If we do not diverge or give a crack in correlation via SMT at the key level, we may get one in the key level itself, where all assets trade into the gap and we see a divergence in the closure of that swing, the lower time frame Candle 2 in the gap. This is where a PSP confirms a swing in a gap.
- A crack in correlation at the key level and in the key level, in this case a gap. We have a true reversal Candle 2, we see expansion, Candle 3 opens forming an SMT fill, an SMT with the gap, and a PSP closure. This is a 2-stage continuation signature. A similar variant sees price expand away from a true reversal and then some form of 2-stage SMT in the gap, perhaps an SMT with a swing and then a consecutive candle SMT. You learned what all of these 2-stage cracks in correlation look like in the previous lecture.
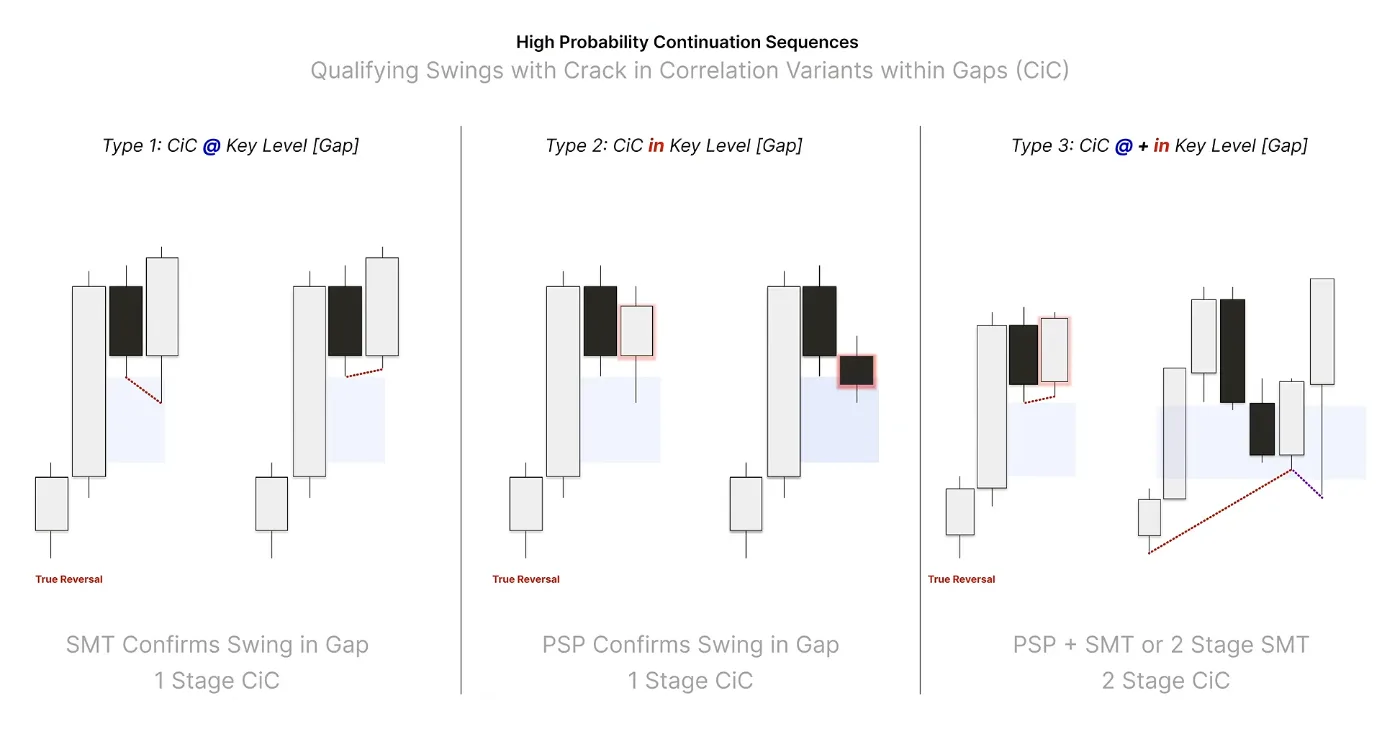
To sum up: when qualifying a swing formation in Candle 3 or Candle 4, we use either one-stage cracks in correlation in gaps or 2-stage cracks in correlation in gaps to validate the low or the high of the continuation wick. That is critical. In the logic of a continuation, it is not necessary to have a 2-stage crack in correlation inside your key level. Why? Because the market has already formed a swing formation on the higher time frame, denoted by the true reversal, and the expansion away from the low confirms the universal model narrative: we are going from one relevant level, reversing, and trading toward another relevant level, our objective. Often we only see a one-stage crack in correlation, either an SMT fill, or a crack in correlation at a gap, a PSP inside the gap, and sometimes we do see the 2-stage signature. This is the only way a continuation forms, in all cases. Write this down: this is your high probability sequence.
Here is what this looks like on a higher time frame and lower time frame schematic. If we have a higher time frame universal model with a true reversal, expansion away, and then a retracement in Candle 3 into a gap, we look for these variants in the gap. If this is the low of the Candle 3 wick, you are looking for an SMT fill with the gap, a PSP closure of a lower time frame Candle 2 in the gap, or a 2-stage crack in correlation of that Candle 2 in the gap.
One more time. We reverse on the higher time frame away from a key level. Then Candle 3 opens up into a fair value gap. If we are reversing on the daily chart, we open into a gap on the 4 hour or 1 hour, and we form some sort of SMT or CiC signature. What does that reversal on the lower time frame look like? The same things you learned for reversal signatures: the CISD, gaps being created, the creation of propulsion blocks, all of that.
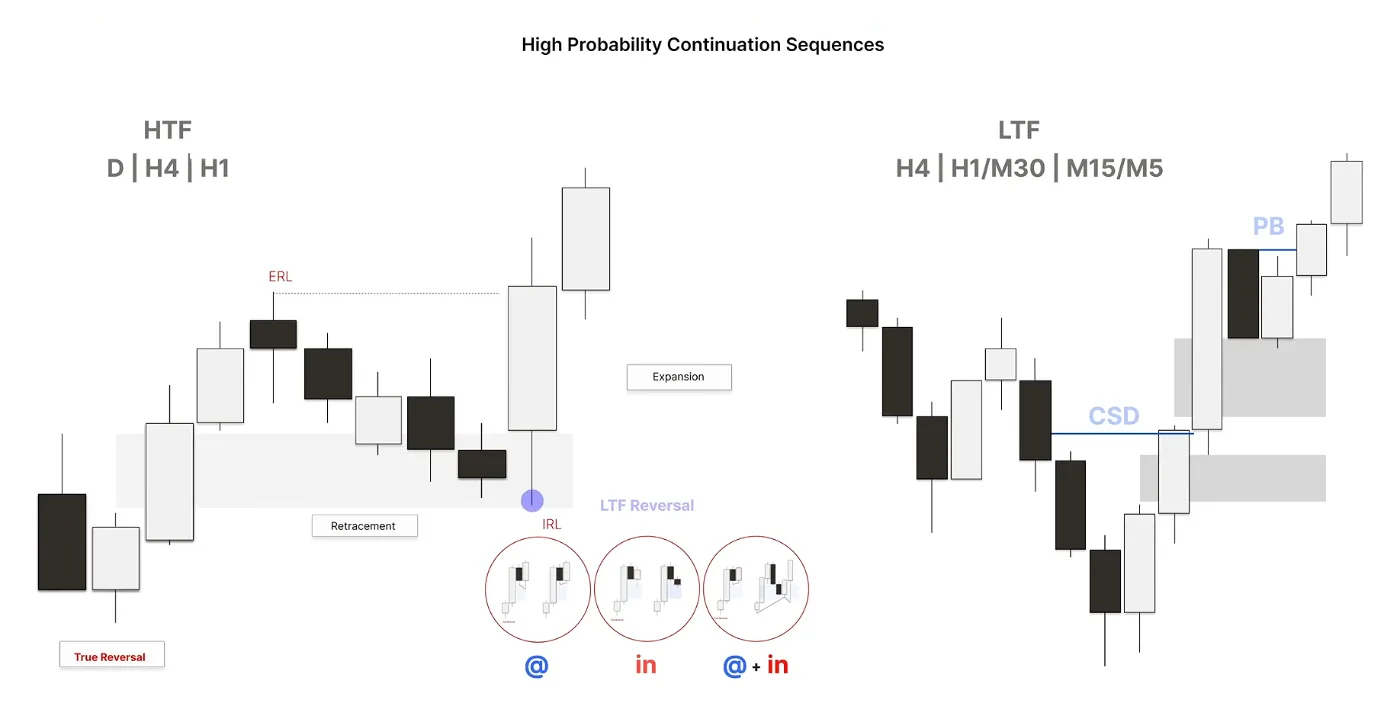
So the only core difference between trading a Candle 2 and a Candle 3 is the requirement of crack in correlation. For a Candle 3 we use fair value gaps, and in those fair value gaps for Candle 3 we expect to form the wicks of the continuation candles, as a continuation sequence that can look like Type 1, Type 2 or type 3 cracks in correlation. You now have a complete and structured logic to frame continuations of all universal models. So if you do not trade the reversal, you can now trade Candle 3 toward the draw on liquidity as long as the draw is still open. This is very powerful and uses the same logic I have taught you extensively in the past.
Asset Synchronization
Now some more complex topics: asset synchronization for continuations using Strength Switching, and the highest probability sequence for asset synchronization, meaning where one asset trades into a higher low and another asset has yet to do so.
Recall from the first lecture the sequence where we see a true reversal, a leading asset expand into a key level, and the middle and lagging assets in the triad form divergence. Because we are trading away from a true reversal, we can anticipate that when price reaches this key level on the leading asset, and it fails to reverse, remember the continuation signatures, it can consolidate, it can retrace into a gap, we expect all assets to actually break that high. How do we get from this very shallow SMT to that high? We are trading away from a true reversal, this asset is not reversing yet, so we expect this asset to get to that high as well. We can look at some Strength Switching continuation signatures to get to the high. This is referred to as lagging asset distributions.
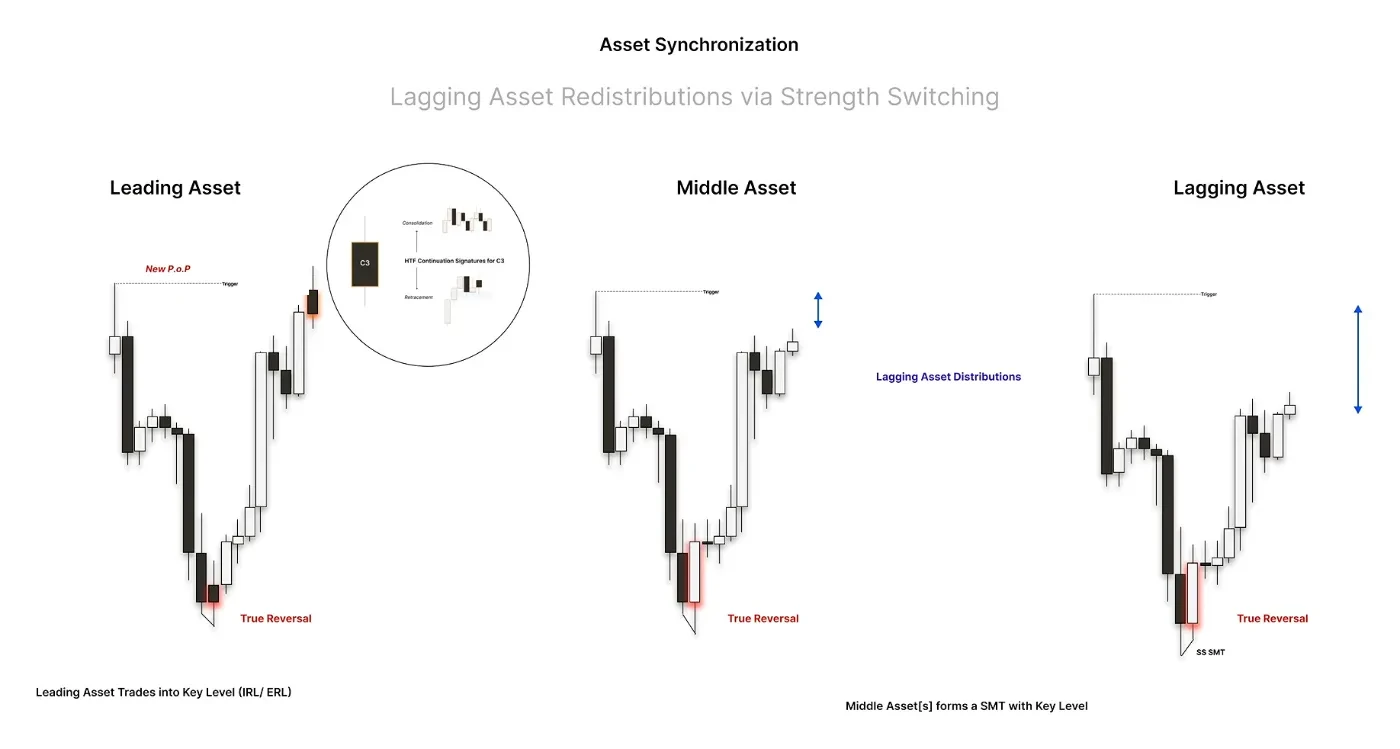
Put it on a page. We enter a new phase of price in a key level, we form this very deep premium or discount SMT, and the question is: how do we get that middle asset into the high, breaking that SMT? Perhaps the lagging asset is quite far from the high, so it can form a relevant swing and reverse, but we need to see the middle asset break the SMT. We use a sequence I will teach you, referred to as the ideal sequence. How do we go from a lagging asset with a very shallow SMT to an SMT break? What does that look like?
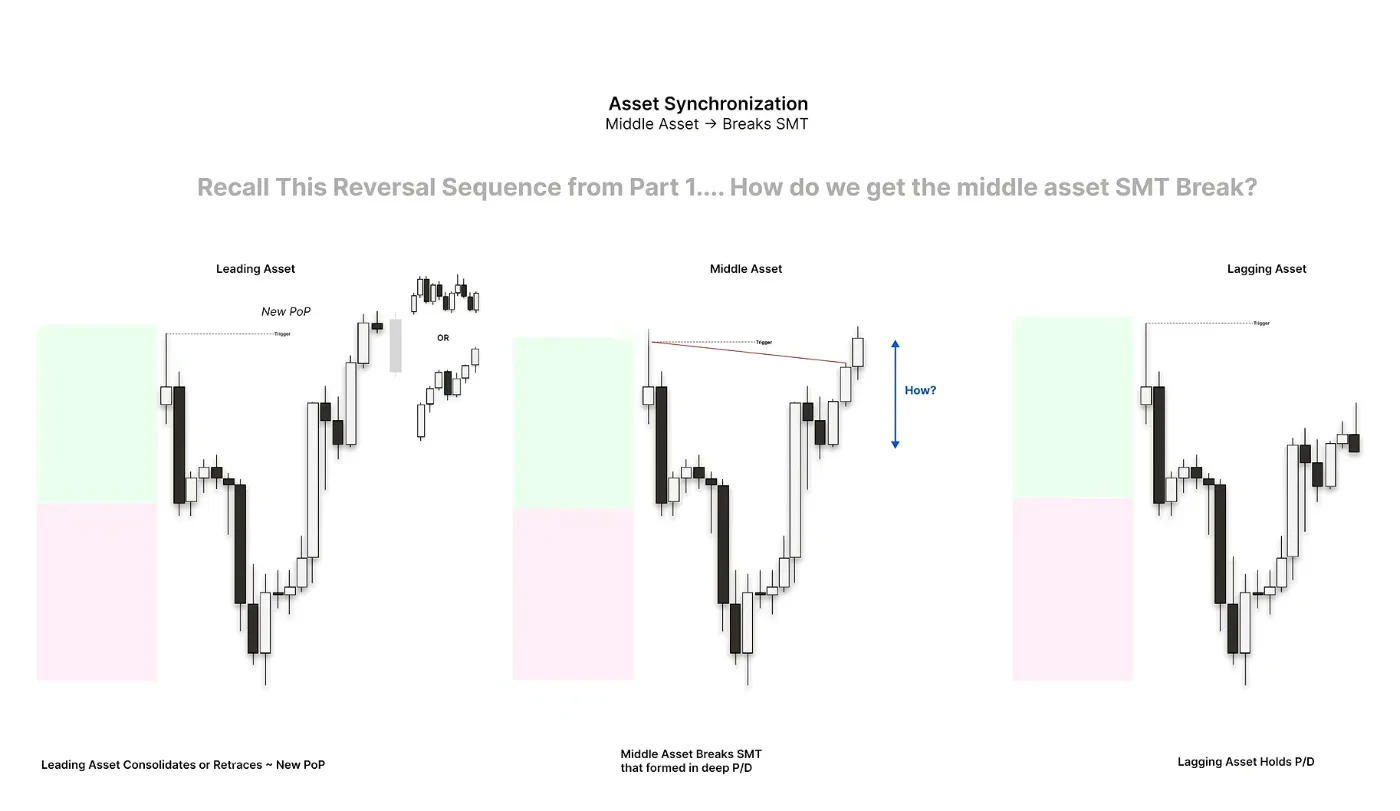
It is the Strength Switch PSP, also known as the ideal sequence. When the leading asset trades into a key level and fails to reverse, and we must see that failure to reverse, I do not want a V-shaped signature or displacement lower on all assets. I instead want this asset to form a continuation or holding signature, a consolidation or a retracement. This is best captured on the middle asset through the ideal sequence of a Strength Switch PSP and an SMT fill.
Imagine the leading asset. We expand into the key level and form the SMT. Then we see a new phase of price, consolidation or retracement. The key is that the leading asset forms a down-close candle. That tells us the asset which is most bullish is retracing or consolidating, leaving a gap, while the lagging asset is bullish, trying to catch up to that high.
Why is the gap so important? The gap shows institutional intentionality to bring price to that key level on all assets. So as price forms the Strength Switch PSP first, that is the first part of the sequence, we then wait for an SMT sequence inside the gap to trade the lagging asset toward that same key level. So this is a 2-stage variant of continuation: first a Strength Switching PSP, which I taught you in part one, and second, confirming a continuation via an SMT fill. The up-close candle or the down-close candle can form the SMT in the gap, that is not relevant. What is most relevant is seeing the leading asset switch strength momentarily, to be weaker, while the lagging asset catches up to break the SMT and trade into the key level. That is what we refer to from now on as the ideal sequence: a Strength Switch PSP and an SMT fill.
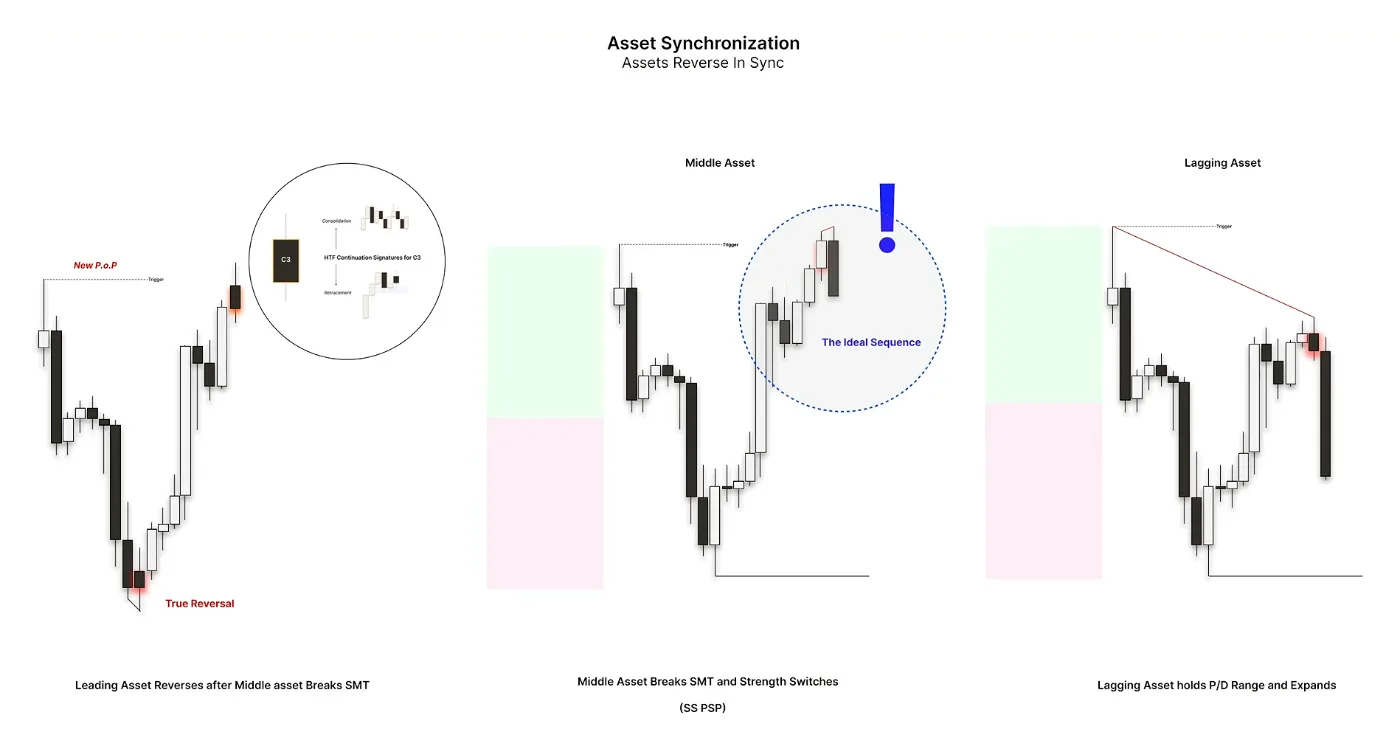
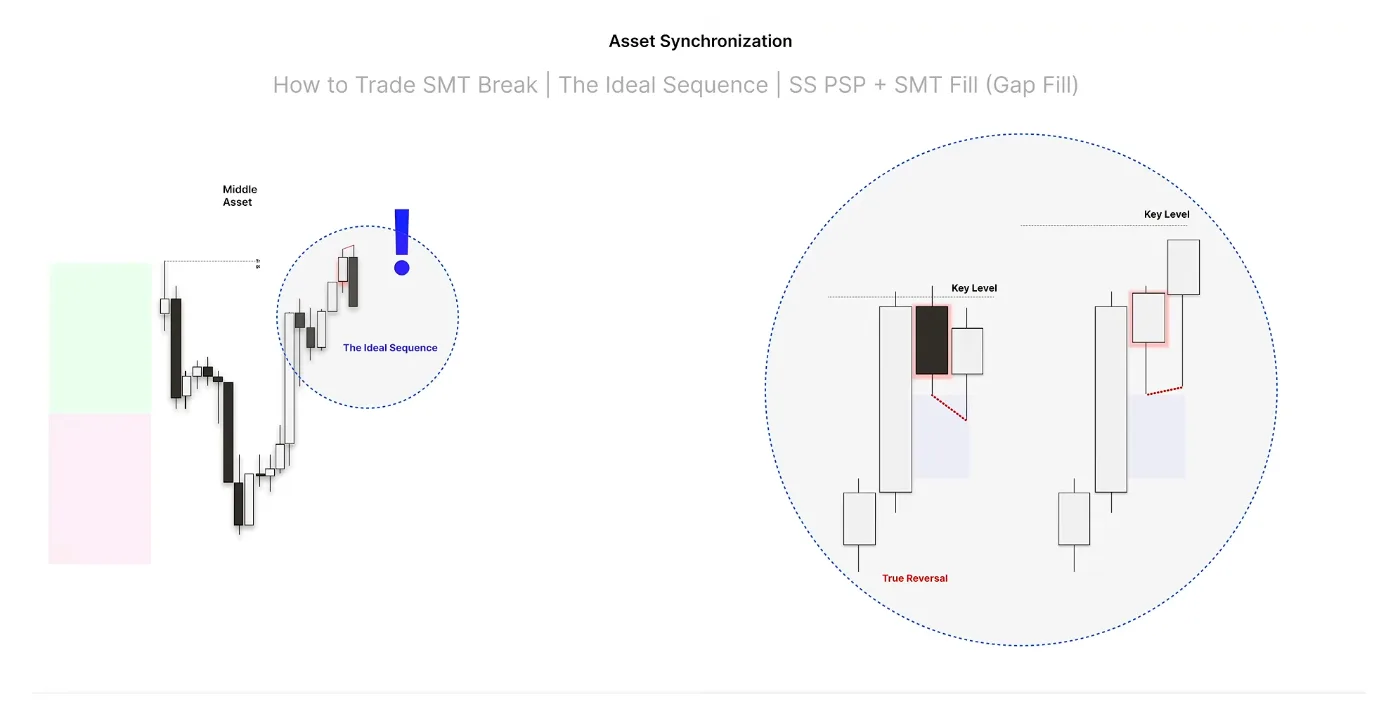
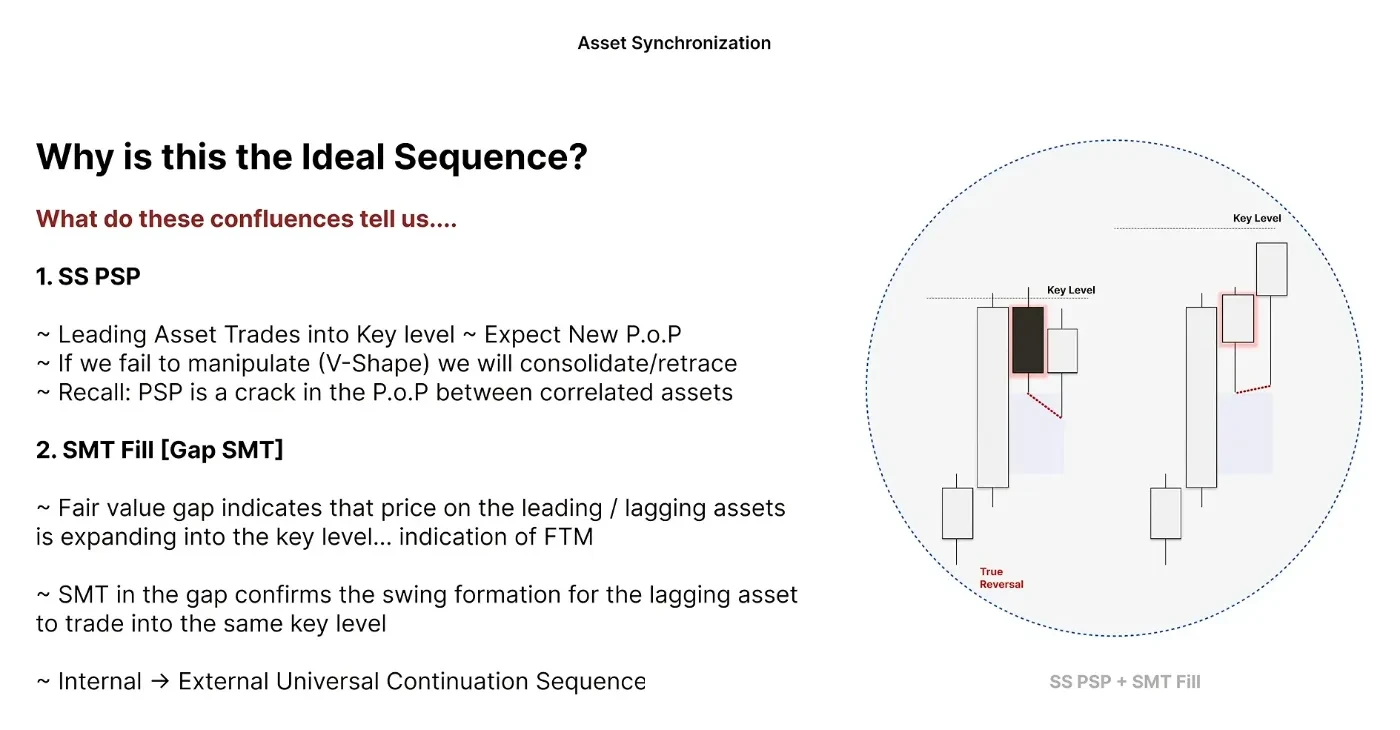
To put this on a page for your notes. Why is this the ideal sequence? A Strength Switch PSP tells us we can expect a new phase of price and that we are failing to manipulate from that key level. Recall that a PSP is a crack in the correlation between assets, a crack in the correlation of the phase of price. Once we create the gap and have the Strength Switch PSP, a fair value gap indicates that price on the lagging asset wants to expand into the key level as well. Once we see SMT in that gap, we can form a swing formation: we validate a swing formation for continuation via a crack in correlation, and we then trade that lower time frame universal model of internal to external. When we see a leading asset fail to manipulate a key level, this is how I will often trade a lagging asset distribution into that same key level, also known as SMT breaking. A very important concept, very simple once you train your eye to see it, and exceptionally powerful when framing your continuations of lagging assets.
Learning it alone isn’t easy...
Learn The Lathyrus Model with direct guidance from our coaches.
- 10 live streams every week
- Regularly updated in-depth course
- 450+ hours of live stream recordings
+ more
Premium/Discount Filters
Now let's use some ranges to filter our gaps. What we have done so far is recognize that gaps are the ideal location to frame continuation sequences. So let's talk about how to use premium and discount to filter gaps in continuation.
The first filter is the current candle's premium and discount range. We draw a standard premium and discount from the low of Candle 3 to the high of Candle 3 as it is created, as we expand, and we understand that our stop loss is best positioned in a discount of this expanding candle. That is to say, if we start forming continuation sequences in the upper part of Candle 3, maybe a gap fill sequence in the upper quarter of Candle 3, we do not want to put our stop loss in that premium market. It is better to enter and position ourselves in a discount of this candle before it expands, because that is where a relevant swing will form.
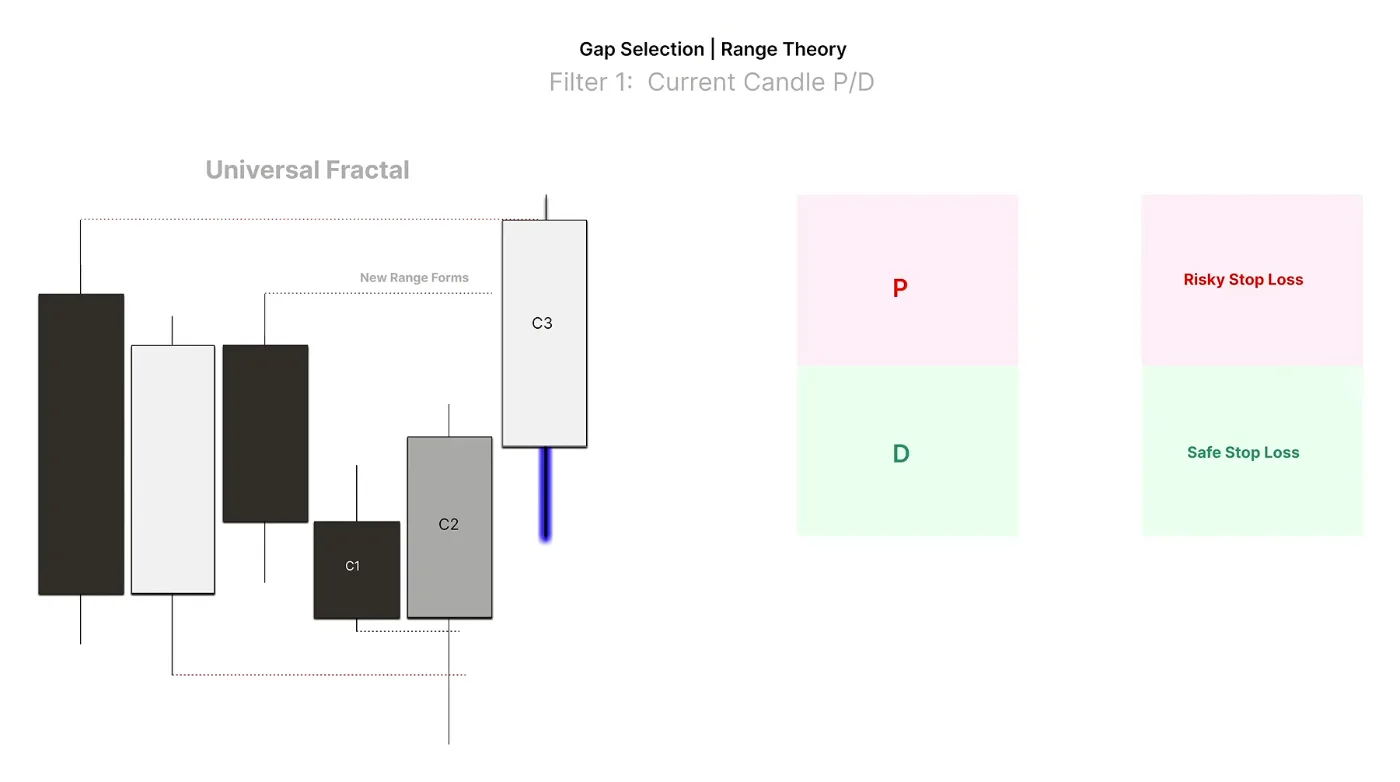
We also apply this logic to the higher time frame dealing range. If we have an area of smart money reversal and a terminus, the other side of the dealing range, we trade with that higher time frame premium and discount in mind as well. When we are in a discount of the higher time frame dealing range, that is a very good entry and location for our stop loss. If we are in a deep premium of the higher time frame dealing range, and perhaps a deep premium of Candle 3 itself, that is where we have to be very picky and demand more swing confirmations. Perhaps a new dealing range in and of itself would be ideal.
On a schematic: when we are below the EQ of the higher time frame dealing range, the implied dealing range, those are valid gaps. We expect gaps that form intermediate term lows, relevant lows, in continuation to hold. As we get higher and higher in the range, we might not see the swings created in gaps with the sequences I taught you hold. So we need to be more picky when we get into deep premium or discount.
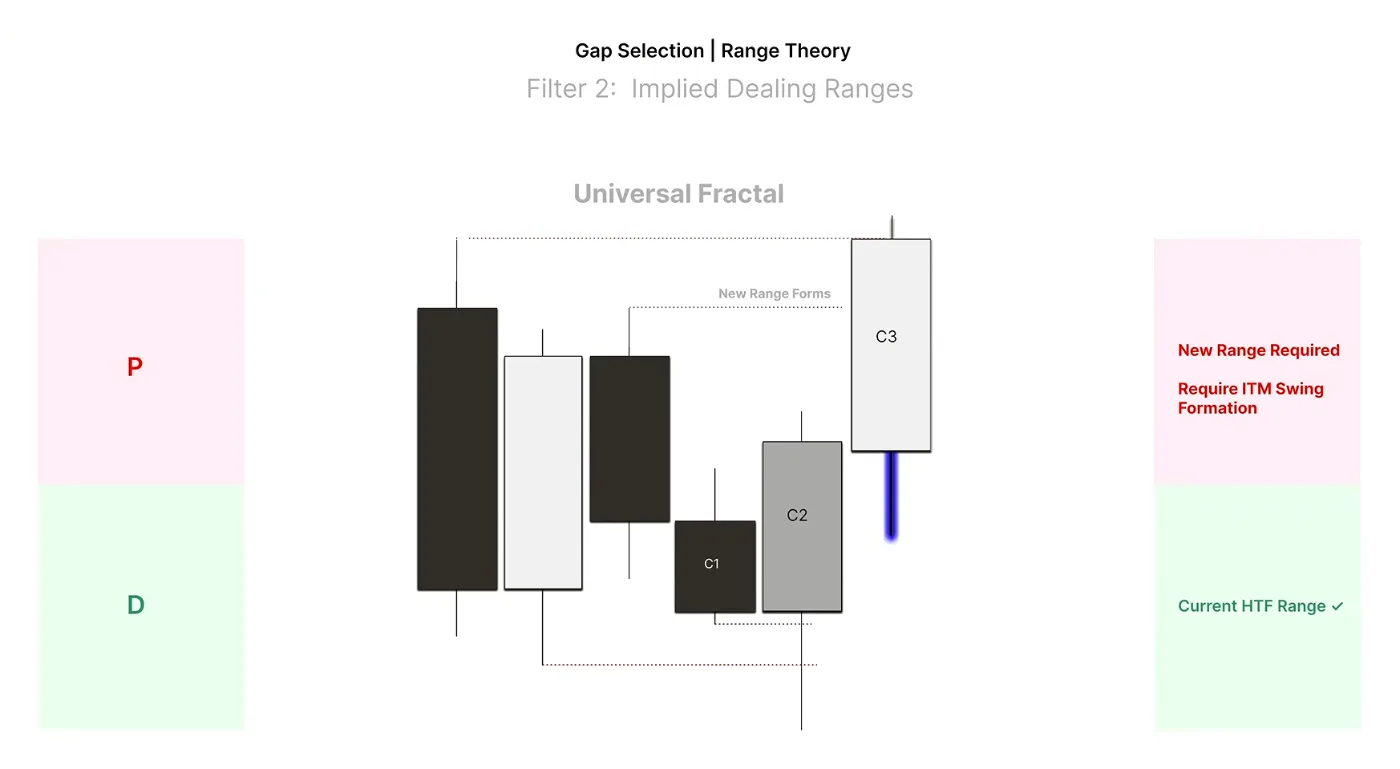
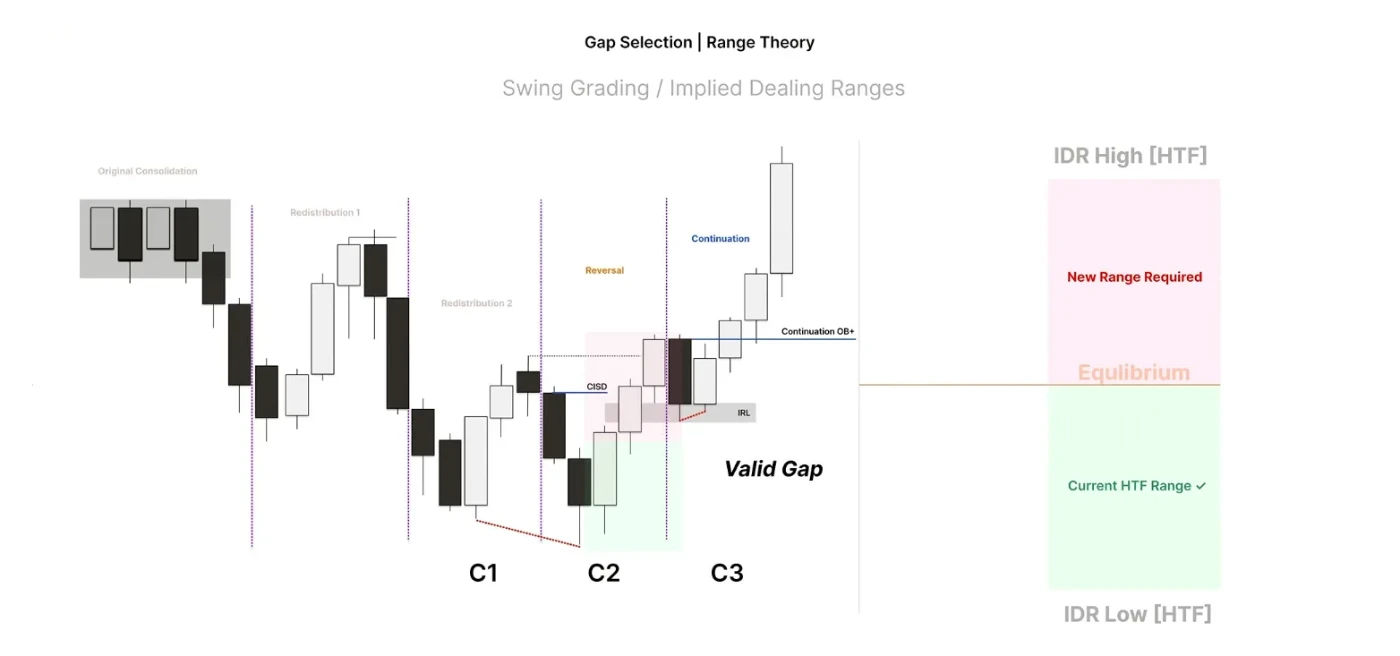
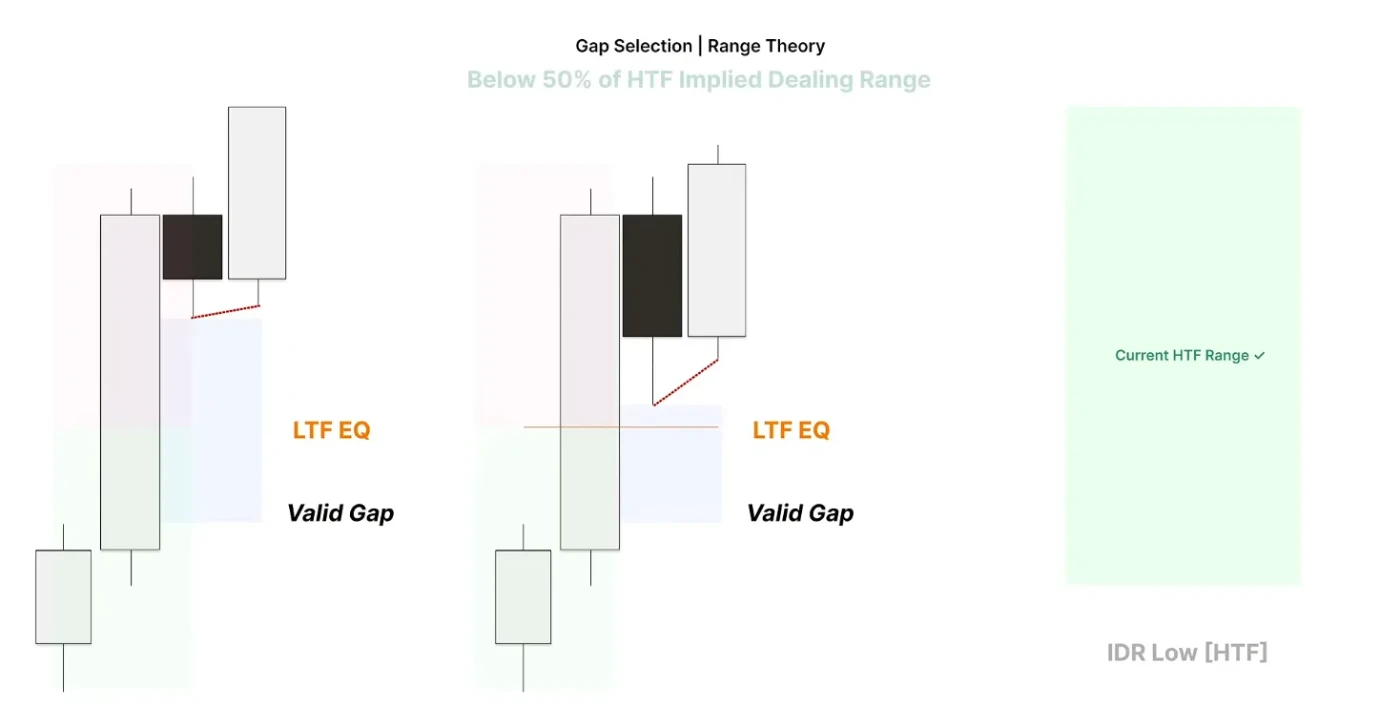
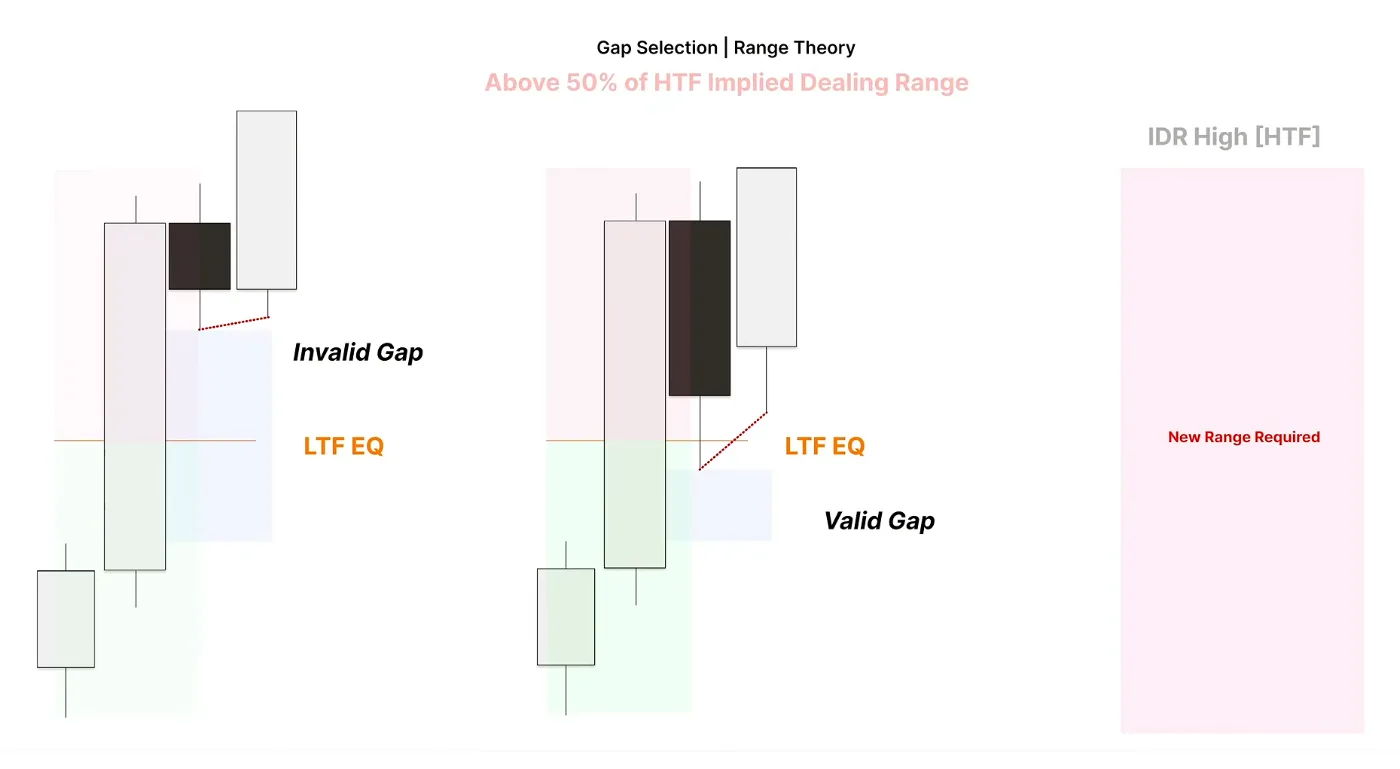
When we have a higher time frame dealing range we are working in and we are in discount, we can take these gaps, whether the gap is at EQ or above EQ of the current expansion: that gap should hold if we are in a higher time frame expansion in Candle 3. If we are in premium of that higher time frame, we do not want to be longing gaps near the high of the candle, because the high of the candle, while in an implied dealing range that is premium, is not a relevant swing. Instead we need to see price retrace into discount of that higher time frame candle.
So we are blending the first two filters: premium and discount of the higher time frame candle, and premium and discount of the higher time frame range. If we are below equilibrium for the higher time frame range, any gap is okay. Generally speaking, you will always take losses and that is completely normal, but these gaps should hold even in premium, because the market is expanding away from a true reversal Candle 2. As we get into premium of the higher time frame range, we ensure that the lower time frame, the current candle's dealing range, is supporting a swing formation with a valid gap. A small nuance; go and backtest it. It is very powerful. It will stop you from longing or shorting the high or low of expansion candles in many cases, and it will keep you on side far more often.
The key takeaways:
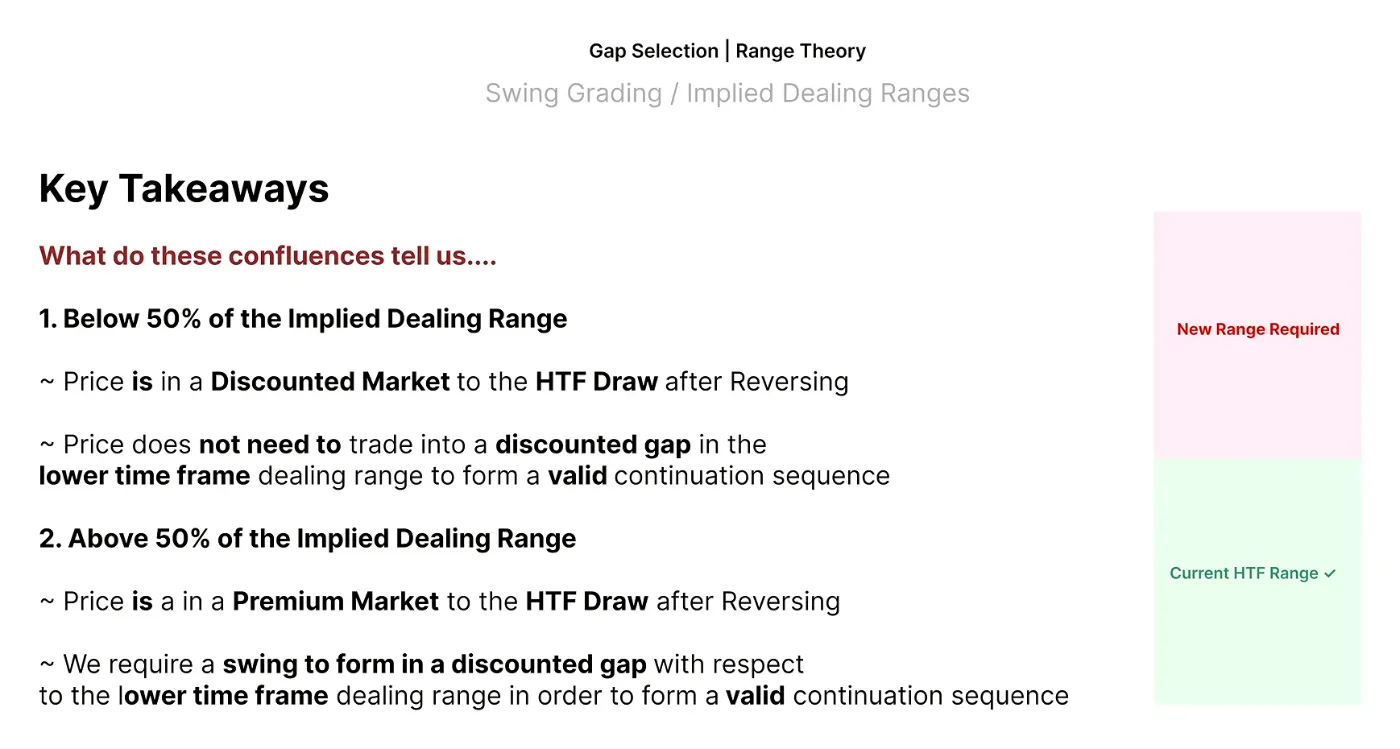
- Below 50%, in a discounted market, we do not necessarily need a discounted gap, although it is nice. We can form valid continuation sequences, because we should be expanding away from a discounted market.
- In a premium market of our implied dealing range, we really do want a swing to form in a discounted gap of the current candle's range. That is where we use the current candle filter to make sure we get on side in a valid continuation sequence, with the stop protected behind a relevant swing.
Advanced P/D Sequences
The last concept before the examples is an advanced premium and discount sequence. I have a complete lecture on this, but we also use APD sequences to qualify whether SMTs will hold in continuation.
Take the leading asset, the most bullish asset, in an expansion for continuation. We have a defined dealing range from the true reversal to the high, and price is retracing into a fair value gap: expansion, retracement, expansion. What we often see on the lagging asset is quite the opposite: we created a high, and the SMT that forms actually takes out the range low. That is how the SMT forms. So for the lagging asset you often see expansion met with expansion, and order paired ranges.
How can we qualify that a gap will hold when markets form such drastic swing point variations? We use this sequence. If we see the leading asset trade into a gap in continuation, in Candle 3, and that gap is in the upper half or near the EQ of the dealing range, we can trust that SMT to hold. That is a very high probability SMT, even if the lagging asset takes out the range low and then order pairs it to reverse. This premium and discount sequence uses fair value gaps near EQ to filter SMT. If the SMT forms far lower in the range, without a fair value gap supporting price, I am less likely to trust it. I talk about that in depth in my APD lecture, but essentially what we use as a continuation logic is the idea of gaps near EQ.
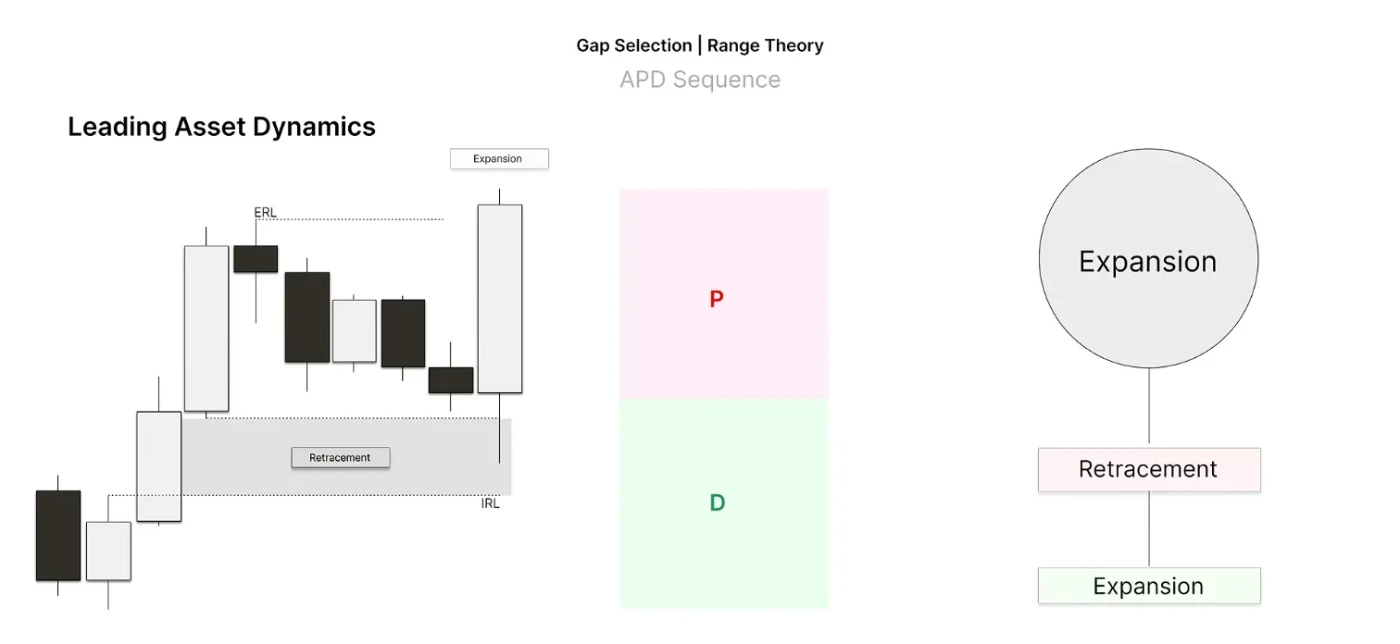
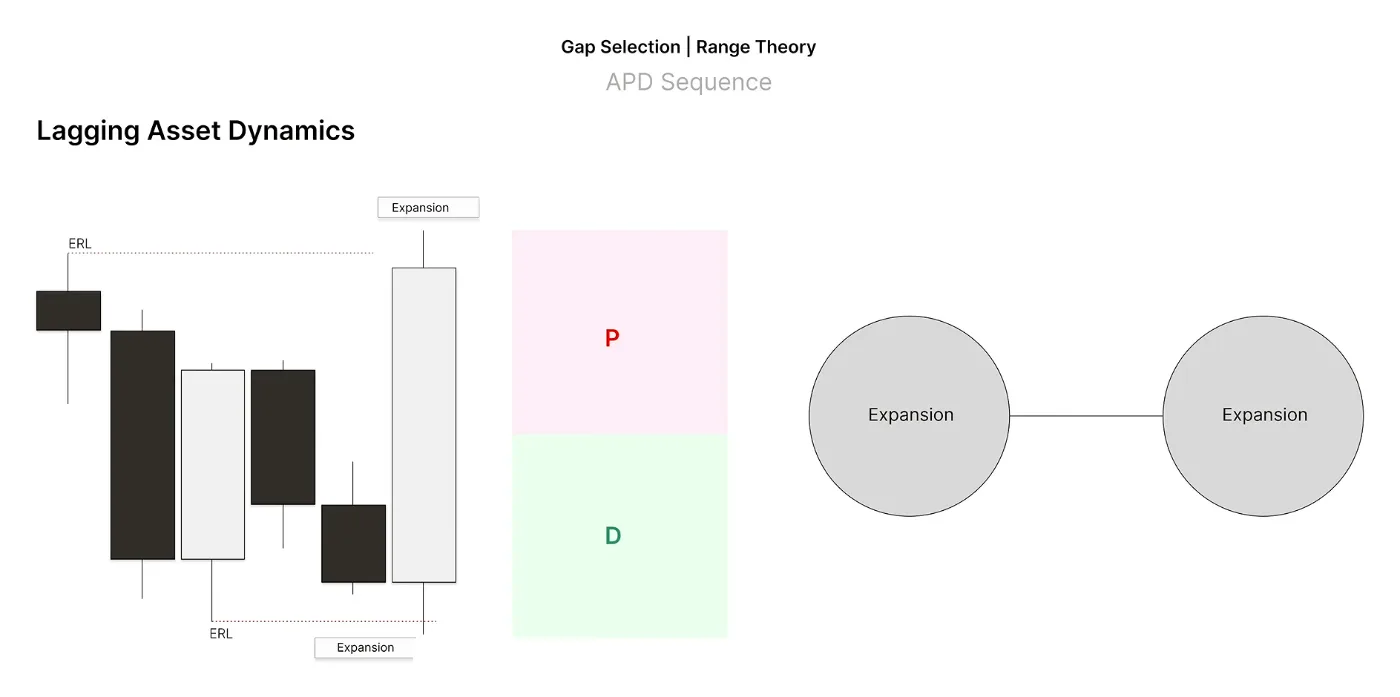
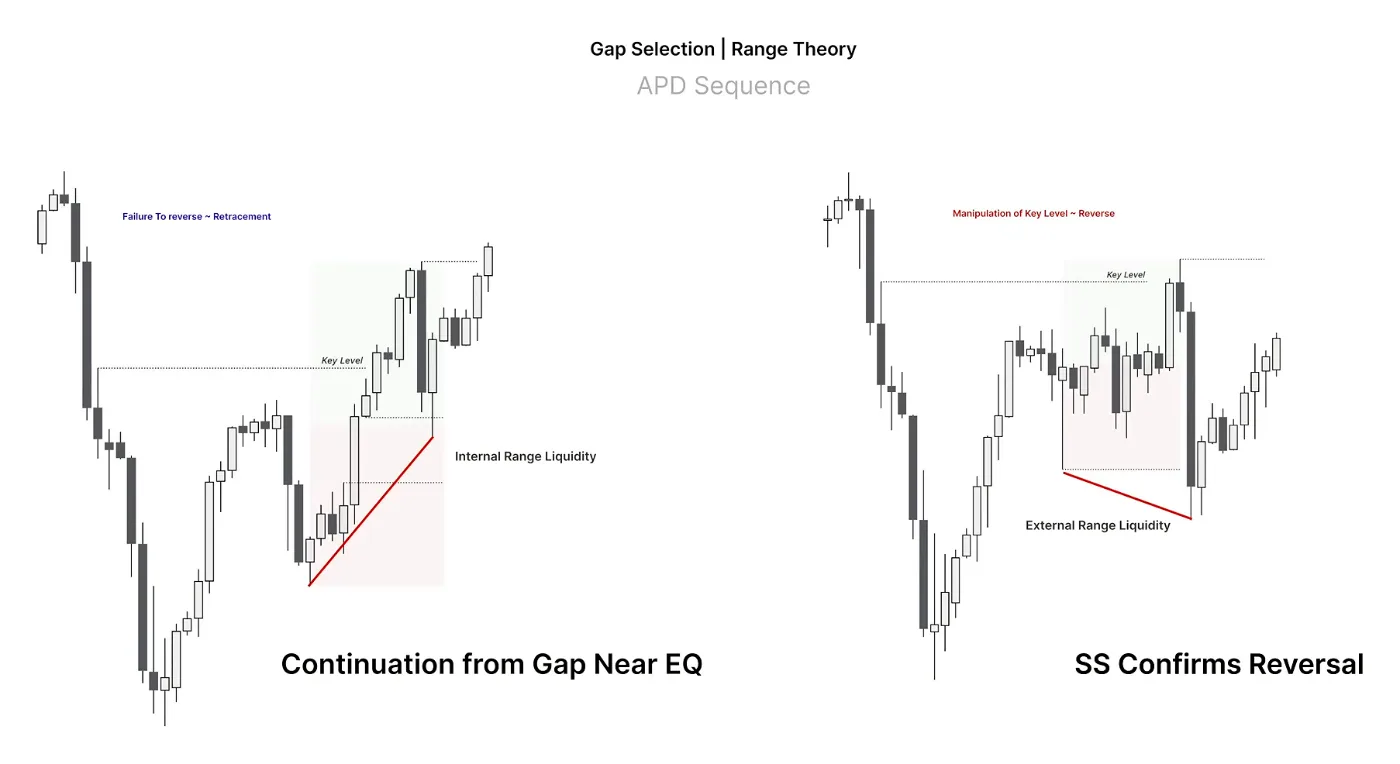
Chart Examples
The chart examples were all live-conducted examples, so please refer to 43:17 in the YouTube video accessible on the right-hand side of this page.
That's the end of this lecture, I hope you found value reading this and you learned something new that you can apply, or further refined your knowledge on this subject.
Back to the top