Introduction
This is the first part of a two-part master class on how to time expansions within the market. This lecture focuses extensively on reversals. Specifically, it bridges concepts such as Market Maker Models, swing point formations and cracks in correlation.
There are a few key ideas I want to emphasize throughout, and I will call back to them in different chapters:
- Expansion requires a swing formation.
- Swing formations are Market Maker Models.
- Market Maker Models are how the market distributes liquidity between internal and external range liquidity pools, i.e. old swing highs and lows, and fair value gaps.
- Every swing is formed with a crack in correlation.
- In-sync assets expand. Out-of-sync assets are in a manipulation phase. We will look at how asset synchronization plays into the creation of swing points as well.
How To Time Expansions In A Reversal
Market Maker Model Basics
Let's start with the three universal model variants. As a refresher, internal range liquidity (IRL) is fair value gaps, or inefficiencies in the market, and external range liquidity (ERL) is old swing highs and lows. The market only moves a few ways, and these are the three.
- Internal to external (IRL to ERL). A trend-following system, a form of expansion into retracement into expansion. Price retraces into a gap and then expands toward an old high or low. This is a higher time frame continuation signature.
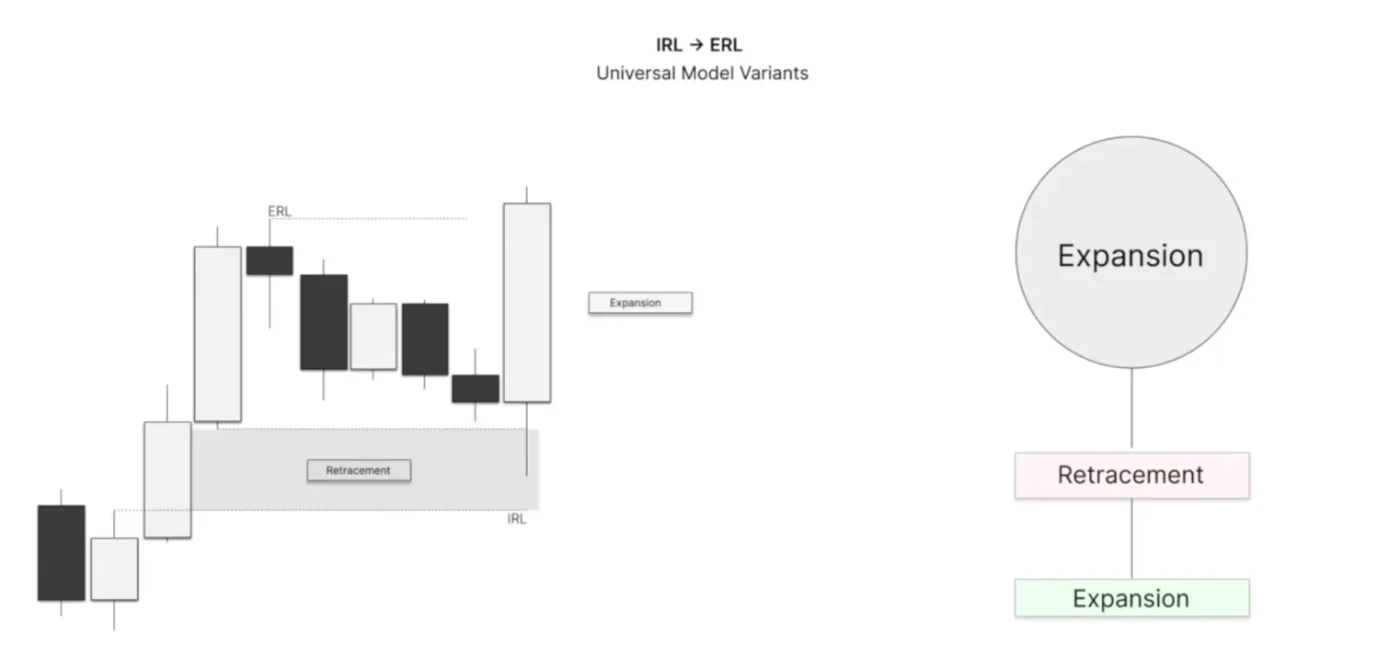
IRL to ERL: expansion, a retracement into the gap, then expansion to the old high. - External to internal (ERL to IRL). A higher time frame form of retracement using this universal model logic. Price expands into a swing high or swing low and then retraces, via expansion, back into an internal range of liquidity to rebalance a fair value gap.
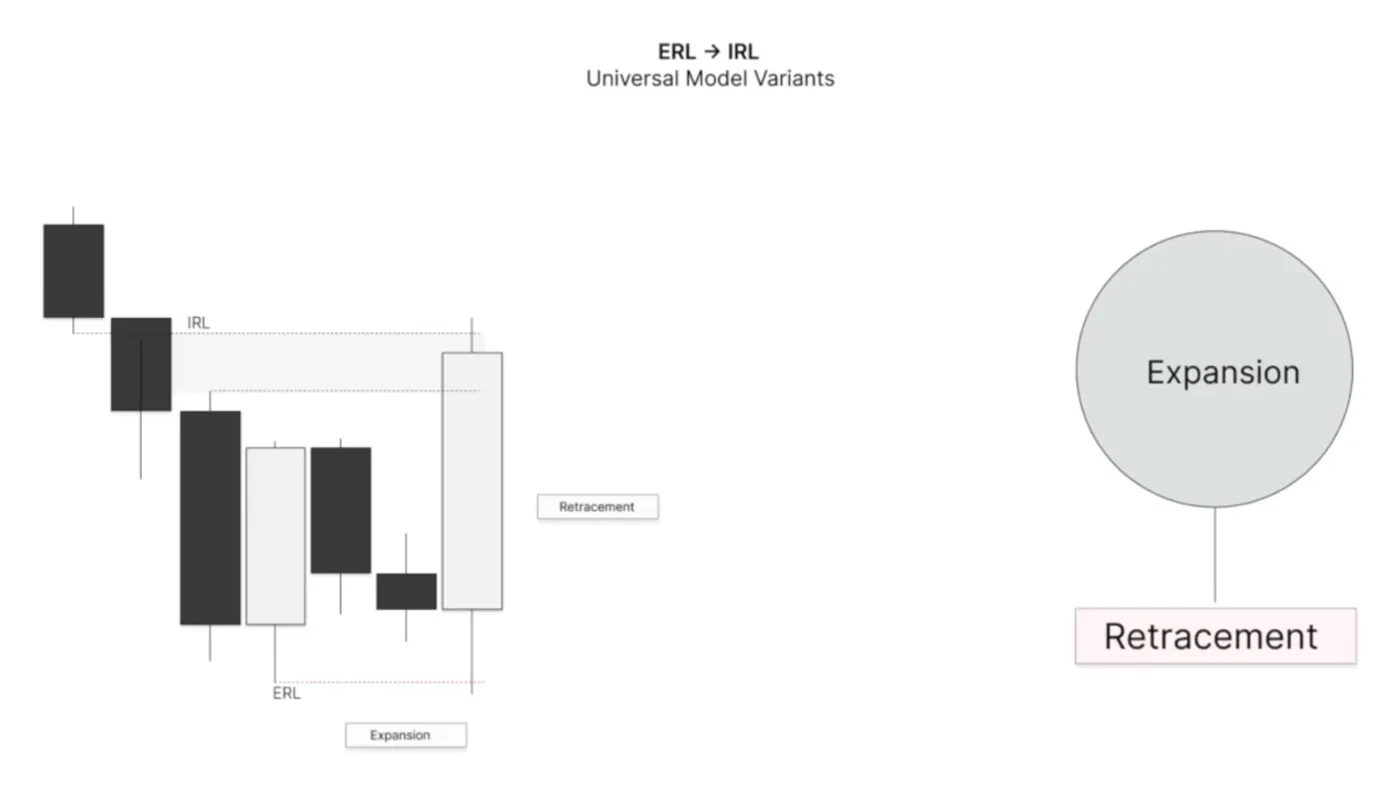
ERL to IRL: expansion through the swing low, then a retracement back into the gap. - External to external (ERL to ERL), an order paired range. Price takes out one side of a range, the range high or the range low, and then expands toward the other side. This is a higher time frame reversal signature.
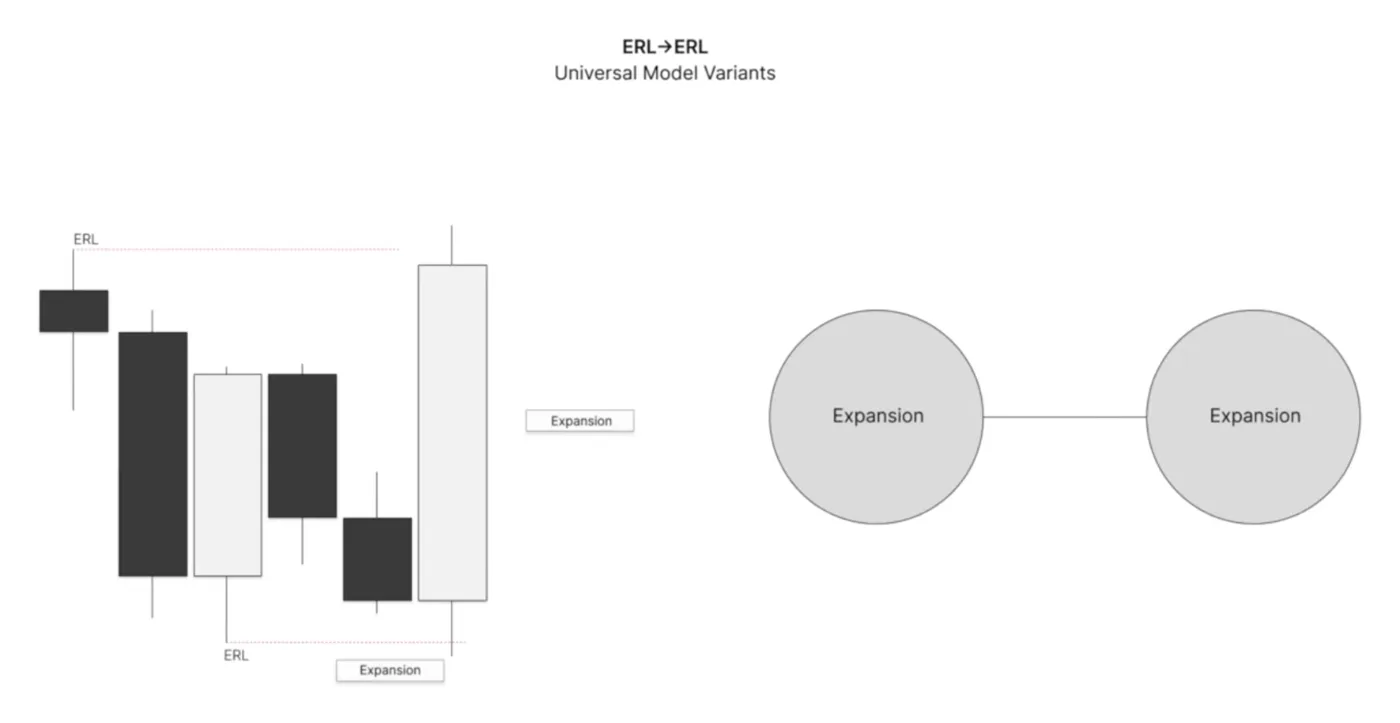
ERL to ERL: one side of the range taken, then expansion to the other side.
Remember these relationships throughout: universal model variants are Market Maker Models, and Market Maker Models are also swing points. Everything that follows is the interaction between those things.
Reversal Candle Signatures
First we need to understand what a reversal is and what a reversal is not. A reversal is expansion met with expansion. When price trades into any key level in the universal model, we want to see displacement back into the range. That is a reversal signature. It can be qualified by a change in the state of delivery (CISD), which you have probably learned about before, and also by displacement, seen in fair value gaps and explosive price action. A V-shape is the verbiage we often use.
What is not a reversal? A reversal is not choppy. It does not create failure swings as it comes into the key level. It is fast in and fast out, creating the change in state of delivery and, most importantly, displacement. The choppy version is more of a retracement. Likewise, a reversal is not consolidation. Consolidation is a phase of price governed by a range that price stays within, not manipulating and expanding outside of it until the reversal signature finally prints.
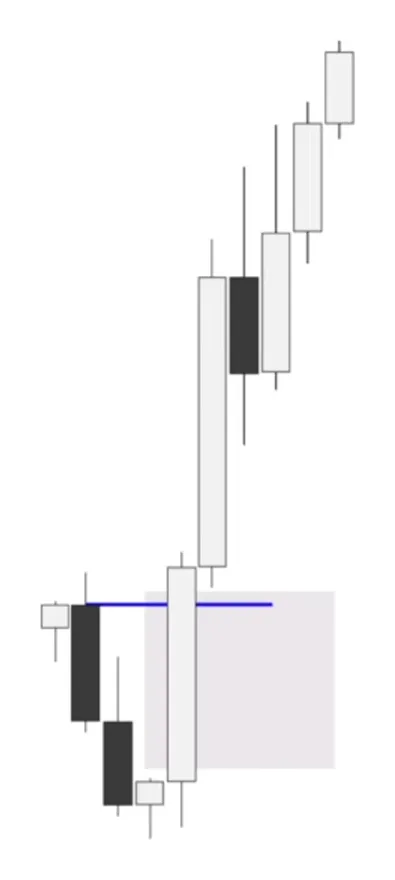
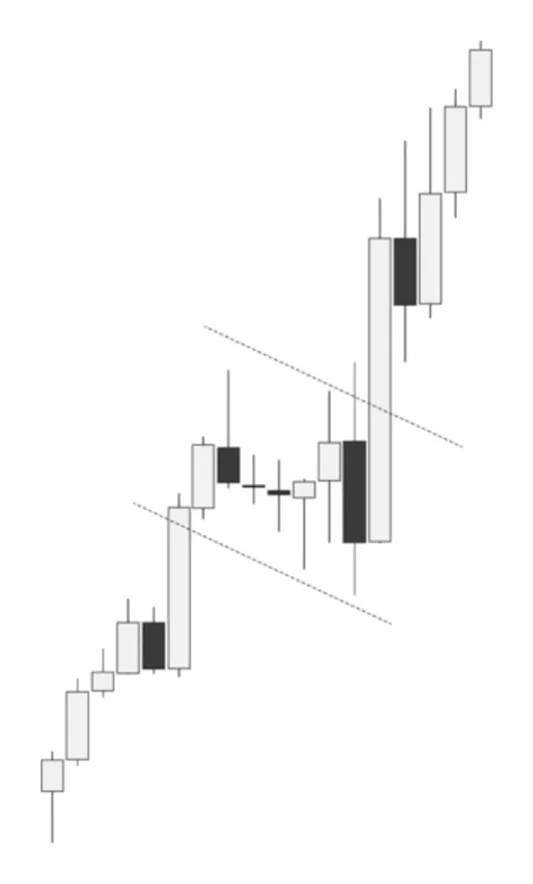
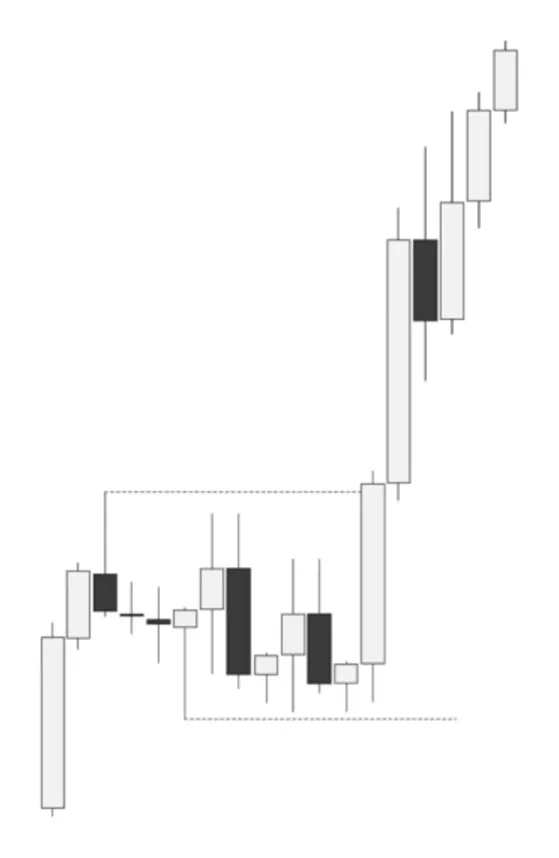
These lower time frame signatures are going to be very important when we look at swing formations and when we trade reversals.
Now let's look at the reversal types of candles in the market and how they form in relation to the universal model. Here is a Candle 2 (C2) reversal. There are two key considerations for these mechanical reversal candles.
- Wick size, the price filter. The wick size is determined by the depth of the protraction, or manipulation, of the candle away from its opening price. A large wick indicates the candle is reversing and mechanically closing back in the range. As a reminder, a mechanical C2 closure sees the first candle's low swept and then a closure back inside the range of Candle 1. The same applies for the bullish and bearish cases.
- Time left in the candle, the time filter. If there is limited time remaining in the higher time frame Candle 2, i.e. the V-shape on the lower time frame that forms the wick happens near the end of the candle, we assume this candle will reverse and the next candle will expand. If there is not a lot of time left, there is not much time for it to expand to the other side of the range.
So we filter our Candle 2s by the size of their wick and by the time remaining to determine whether this is a reversal candle, or a reversal into expansion candle, which comes later.
Swing Point Formation
Here is what a reversal looks like with respect to the universal model and those lower time frame mechanics. In this example we have an external to external model. There is also a time frame alignment to use: if the higher time frame is the daily, the lower time frame is the 4 hour; if the higher time frame is the 4 hour, the lower time frame is the 1 hour or 30 minute, and so on.
Price engages a relevant level, the external range low, and closes as a mechanical reversal candle back above C1's low. On the lower time frame, C2 reverses right after sweeping the previous candle's low, then Candle 3 (C3) opens and continues toward the opposing side of the range, the draw on liquidity.
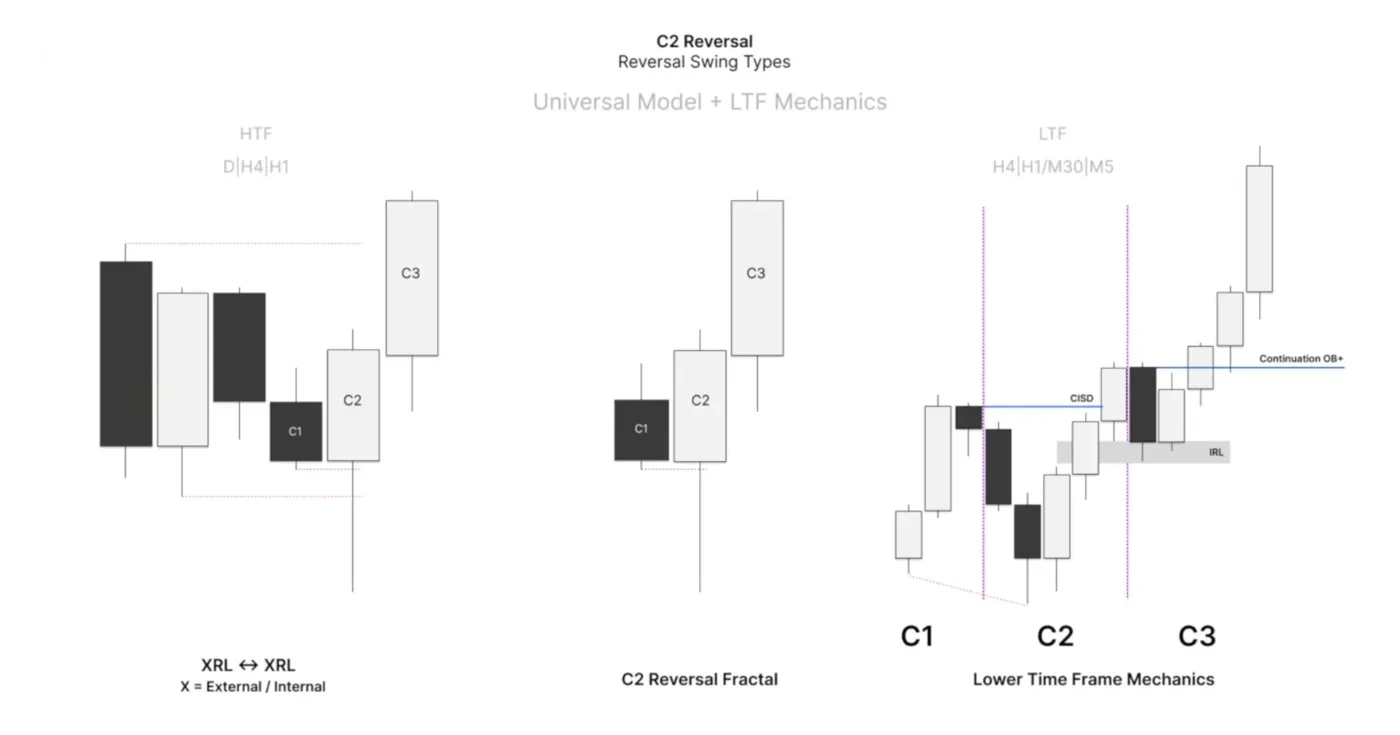
If you are a reversal trader, your emphasis is trading that first change in state of delivery, or perhaps the fair value gap in the displacement leg. If you focus on continuations, which we will cover in a future lecture, you wait for the gap to be filled and look at the sequence inside it, a continuation order block.
Notice that as price reverses in Candle 2, the time left for expansion, considering the draw, is not very much, and there is a very large, exaggerated wick. So our trade preference here is actually to trade Candle 3 as a continuation, simply because this candle reversed. The next candle can form a small opposing run and then expand. Our trade preference for a reversal candle C2 is trading the Candle 3 expansion, a continuation.
Learning it alone isn’t easy...
Learn The Lathyrus Model with direct guidance from our coaches.
- 10 live streams every week
- Regularly updated in-depth course
- 450+ hours of live stream recordings
+ more
Reversal Expansion Candles
This is where the bread and butter of trading reversals comes in, and where I have spent a lot of time investigating how swings form. The C2 reversal expansion candle is characterized in a similar way to a reversal candle, but pay attention to the price and time filters.
- Wick size. A reversal expansion candle has a relatively small wick. The protraction phase, the distance between the open and its low (or the open and its high), is relatively small. That allows the majority of the candle's volume to be used for expansion, creating a larger body.
- Time. If there is lots of time left in the candle, i.e. the reversal happens quickly within the higher time frame candle, there is sufficient time for it to be an expansion candle. That is what we want when engaging price within this type of swing formation.
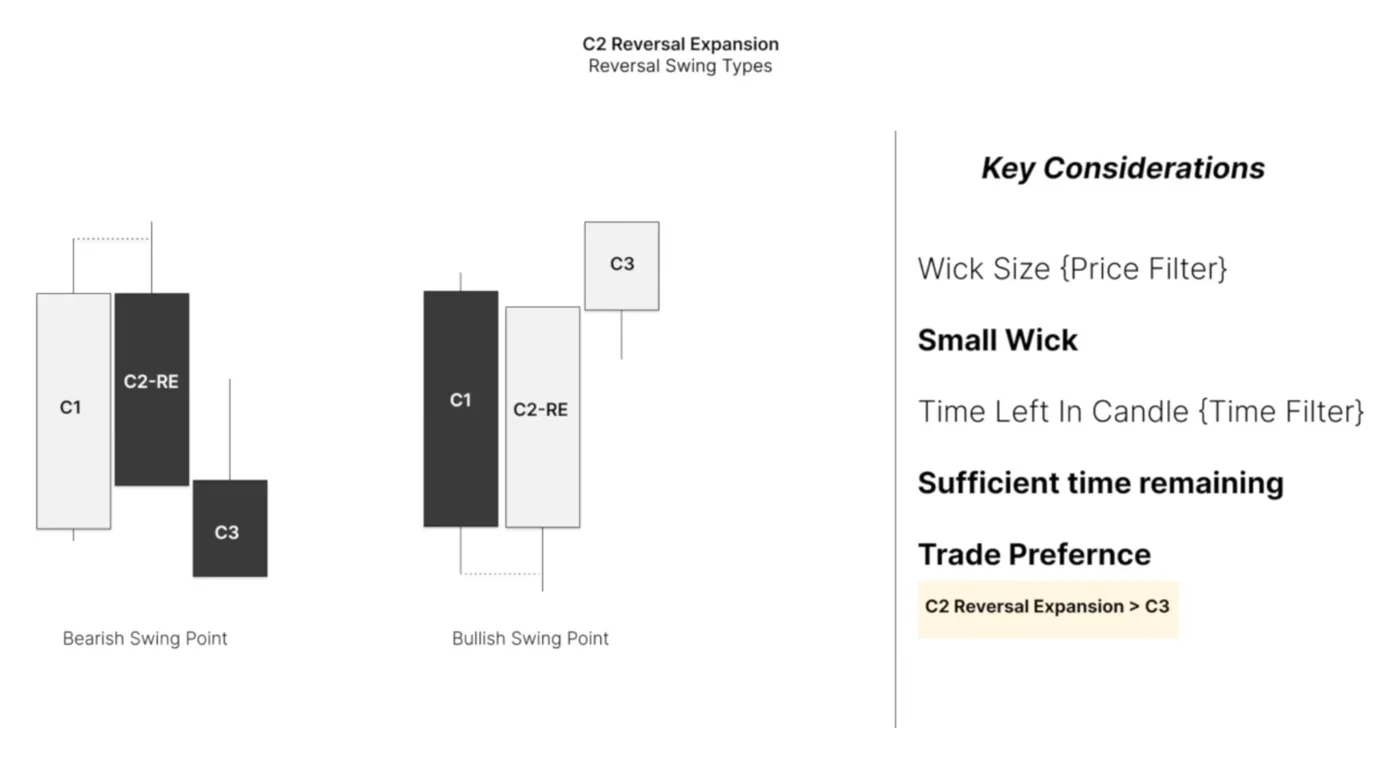
In the universal model example, this time an internal to external variant, Candle 2 forms a small opposing run below Candle 1 into the key level, and then we get expansion higher. On the lower time frame we see a V-shape, and this V-shape is very nice because the CISD happens early in the candle. It then expands aggressively into the highs, with C3 as a continuation.
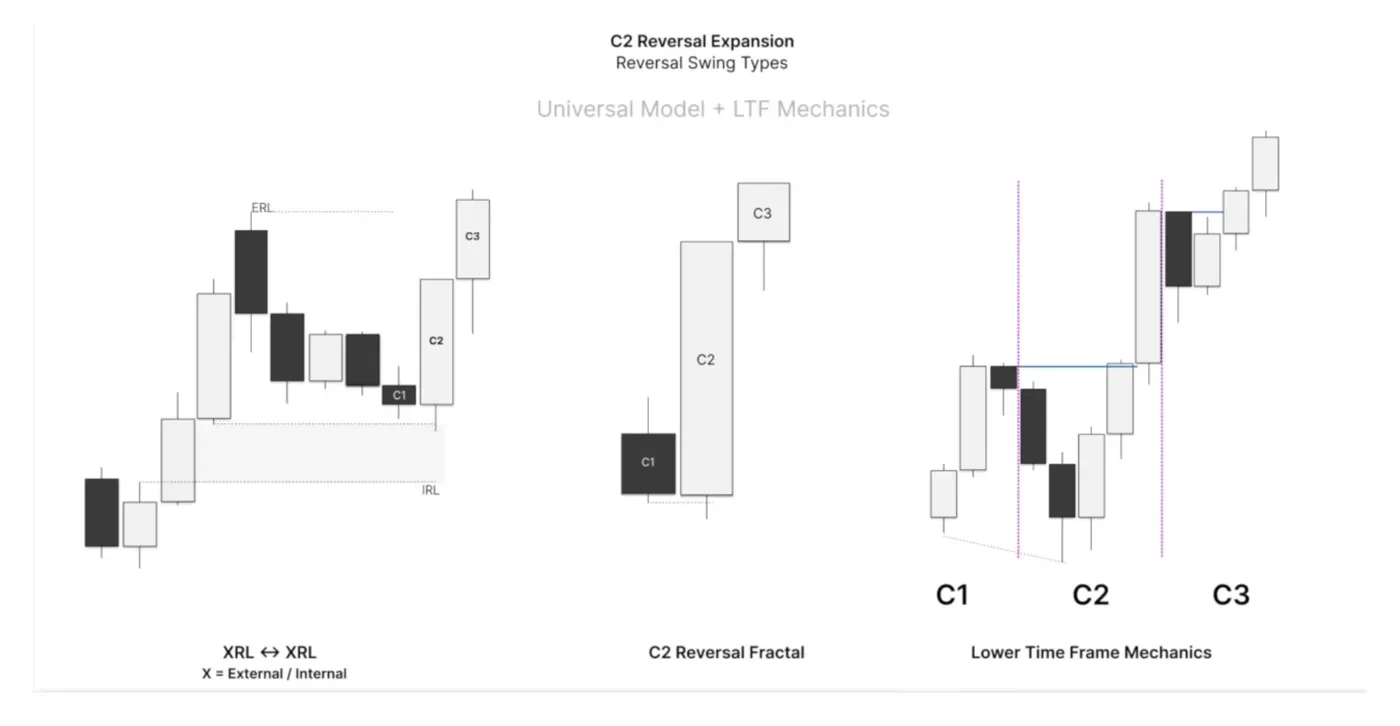
Based on the time it takes to reverse and the relatively shallow wick below the open, this is an ideal candle to trade inside, at the change in state of delivery level, with an invalidation at the low. We will talk more about invalidations later. The difference to understand is the wick size and the type of reversal signature observed, and the time left in the candle for expansion.
C3 Reversal Methodology
The final form of swing formation is a C3 reversal. Mechanically, this is defined when Candle 3 closes below the opening price of Candle 2 (for the bearish case). The closure of that higher time frame candle confirms that the Candle 2 high has formed a swing, despite Candle 2 not closing back within the range of Candle 1.
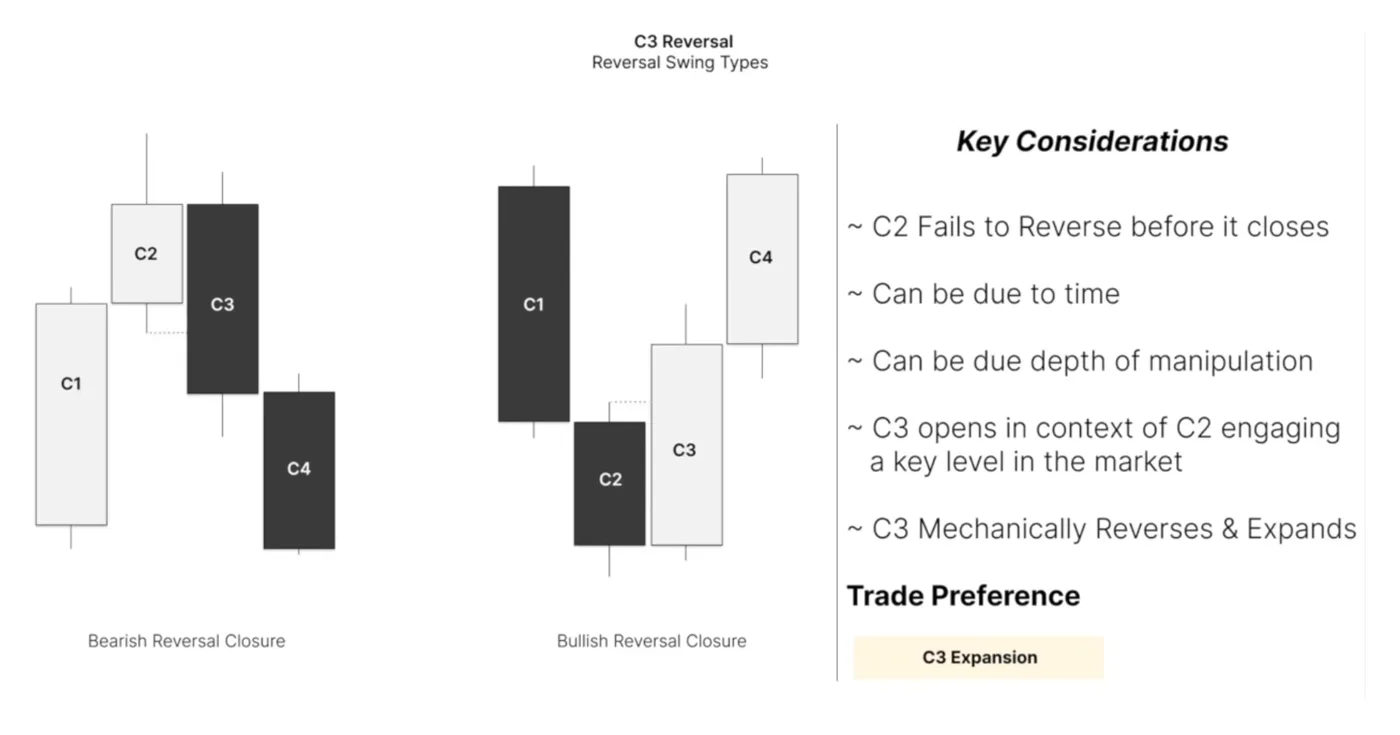
These swings form for a variety of reasons. The key ones to pay attention to are a time constraint on C2, meaning the candle closes but does not have time to reverse because of the depth of the manipulation, or a price signature where there is simply a lot of range to cover back into the range. It is very similar to the previous price and time filters: Candle 2 does not close mechanically as a reversal, so we do not know whether it will form a swing. Candle 3 closing beyond the opening price of Candle 2 confirms it, and Candle 4 is the continuation.
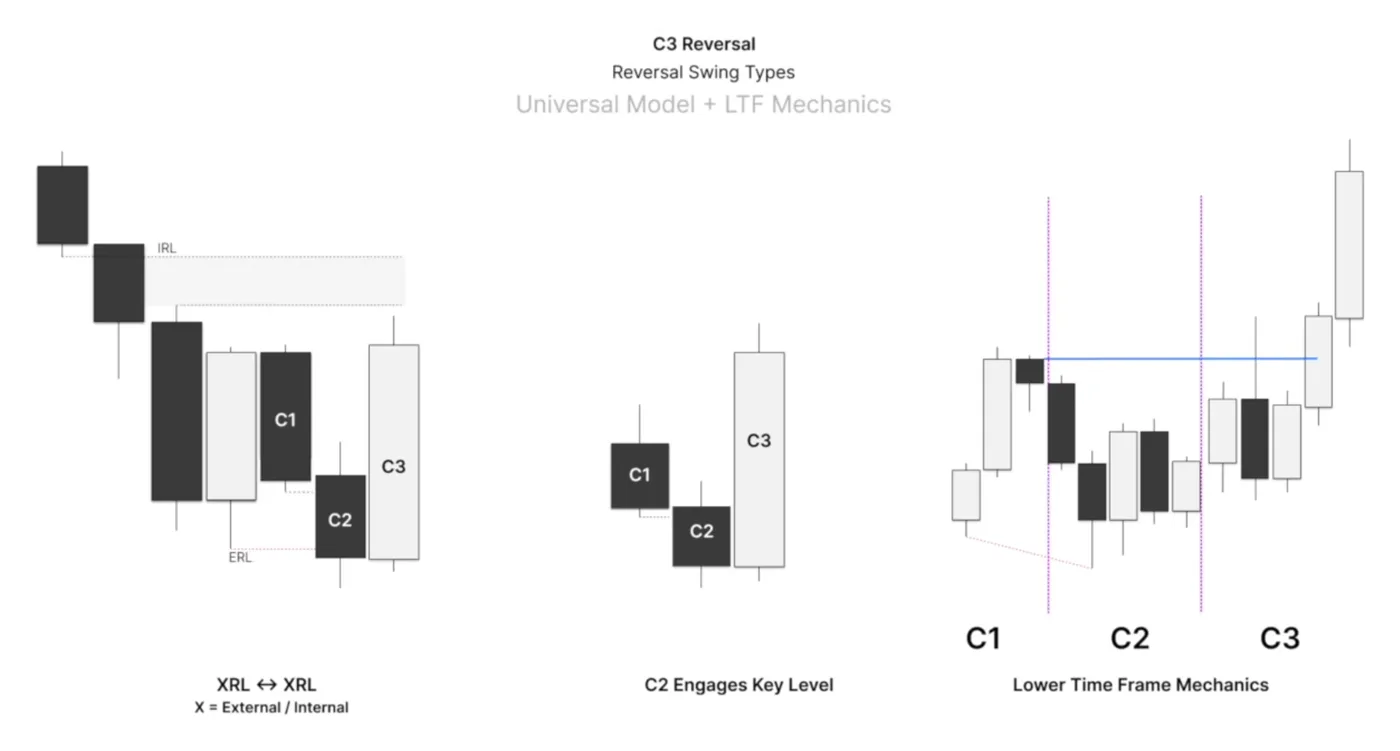
So we can trade C3 expansions, we just need a bit more framework, which comes next. In the example, the third variant, ERL retracing into IRL, C2 engages the low and does not quite close back in the range of C1. We see a failure to CISD back into the range and close above the opening price, and then Candle 3 forms the reversal and closure.
I will teach you a methodology to engage Candle 3 trusting that it will form a low at Candle 2, and we will use the same logic to trust that Candle 2 has formed its low before the candle closes. This lecture focuses extensively on engaging these candles before their closure.
The question that follows from this logic is: if Market Maker Models are swing point formations, whether a Candle 3 closure, a Candle 2 reversal expansion or a Candle 2 closure, how do I know that this low or this high is going to stay intact? How can I be confident trading the lower time frame signature, the V-shape change in state of delivery, trusting the low to hold before the candle closes?
Continuation traders do not have to concern themselves with this. Their emphasis is waiting for the candle to close and then trading the next candles toward the draw once the swing has formed. Reversal mechanics, however, require you to make inferences about where swings form before candles close. How we do that mechanically is through cracks in correlation and divergence. So what follows frames higher time frame reversals before candle closures as a function of divergence and Precision Swing Points at these swing formations, or extremes.
True Reversals And Cracks
Here we go through comprehensively how we frame Candle 2 highs and lows as protected swings before they close, through the logic of a true reversal. A true reversal is always present at every Candle 2 formation in a universal model. They form at the extremes, so we can trade away from them. They are 2-stage cracks in correlation.
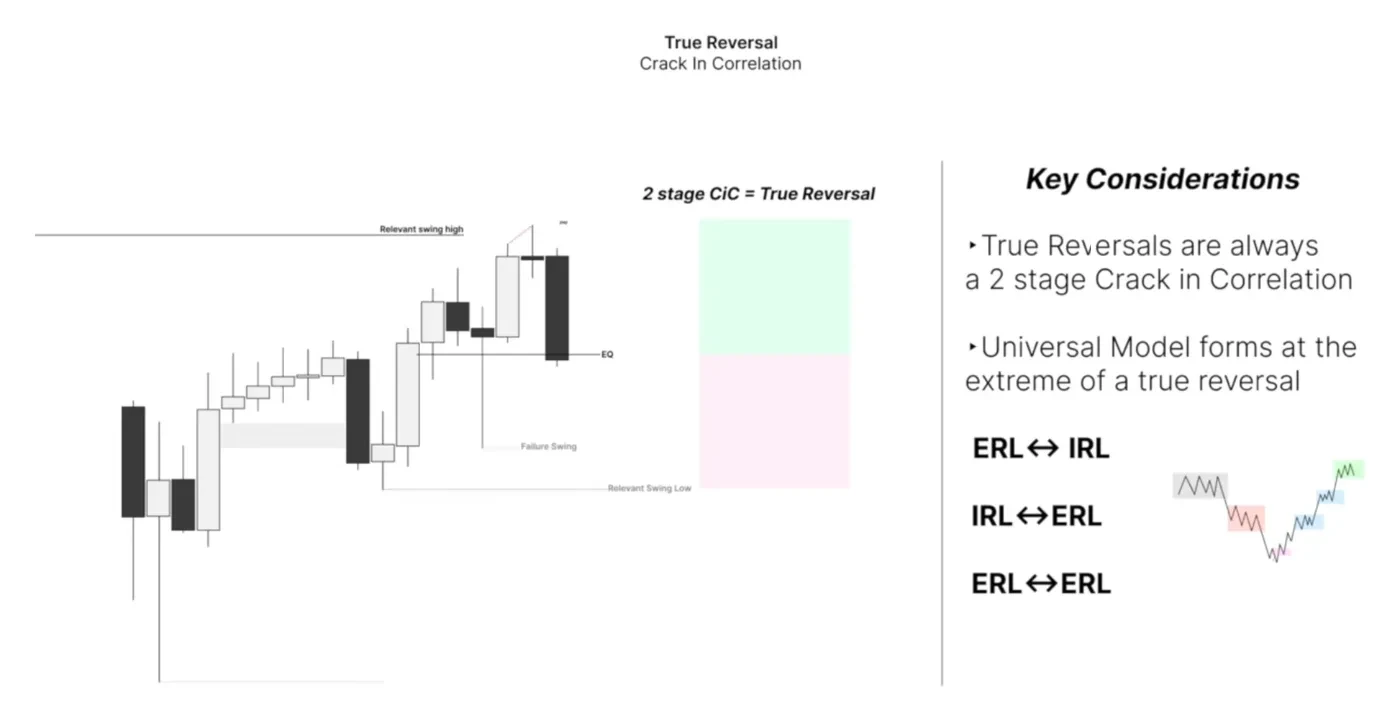
First, assets are correlated in a triad. If we trade the indices, we look at the NASDAQ, the Dow Jones and the S&P. If we trade gold, we look at GC, GBP/USD and GBP/EUR. If we trade oil, we look at HO, RB and CL. There are many more depending on what you trade, but these are the triads we usually focus on as futures traders.
The one-stage cracks in correlation are:
- SMT divergence. A swing high or swing low is diverged at between two or more correlated assets.
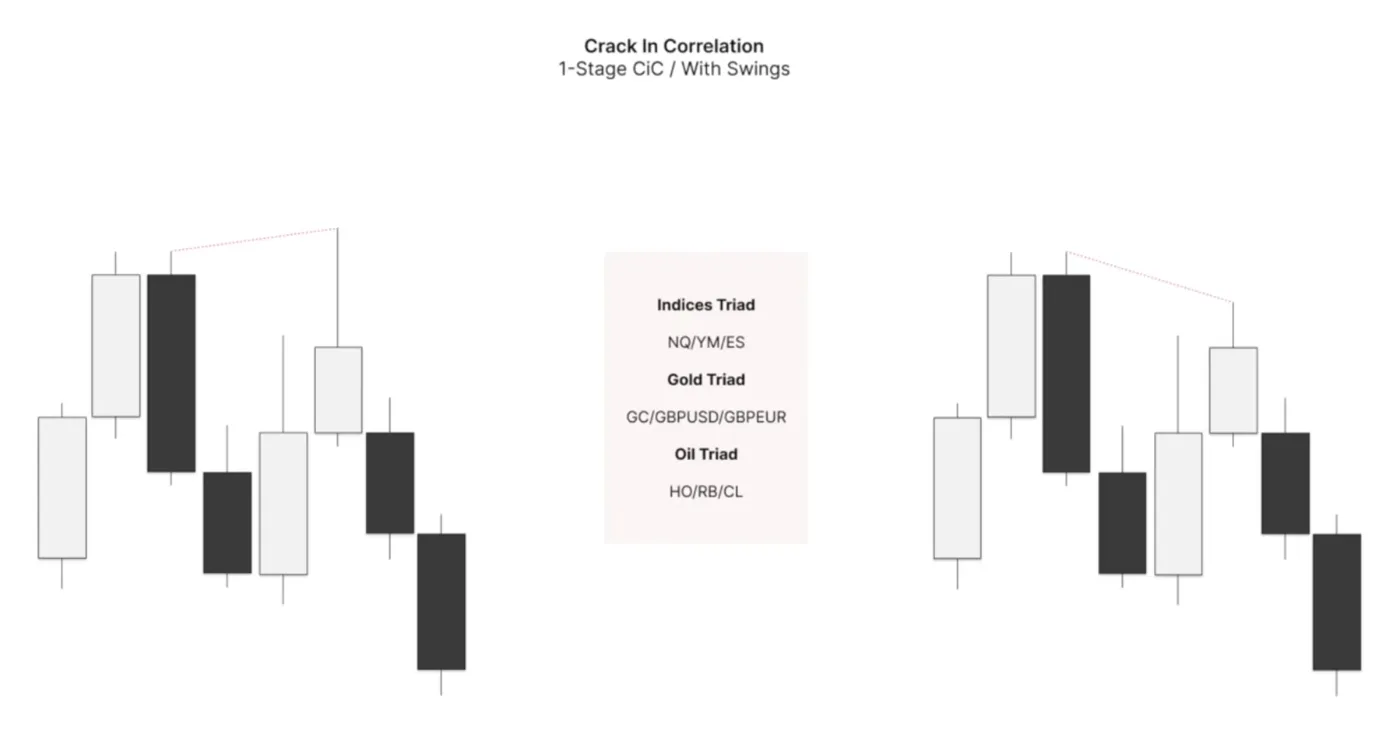
A one-stage crack in correlation with swings: one asset takes the swing high, the other does not. - Consecutive candle divergence (consecutive candle SMT). One candle takes out the previous candle's high and the other asset does not.
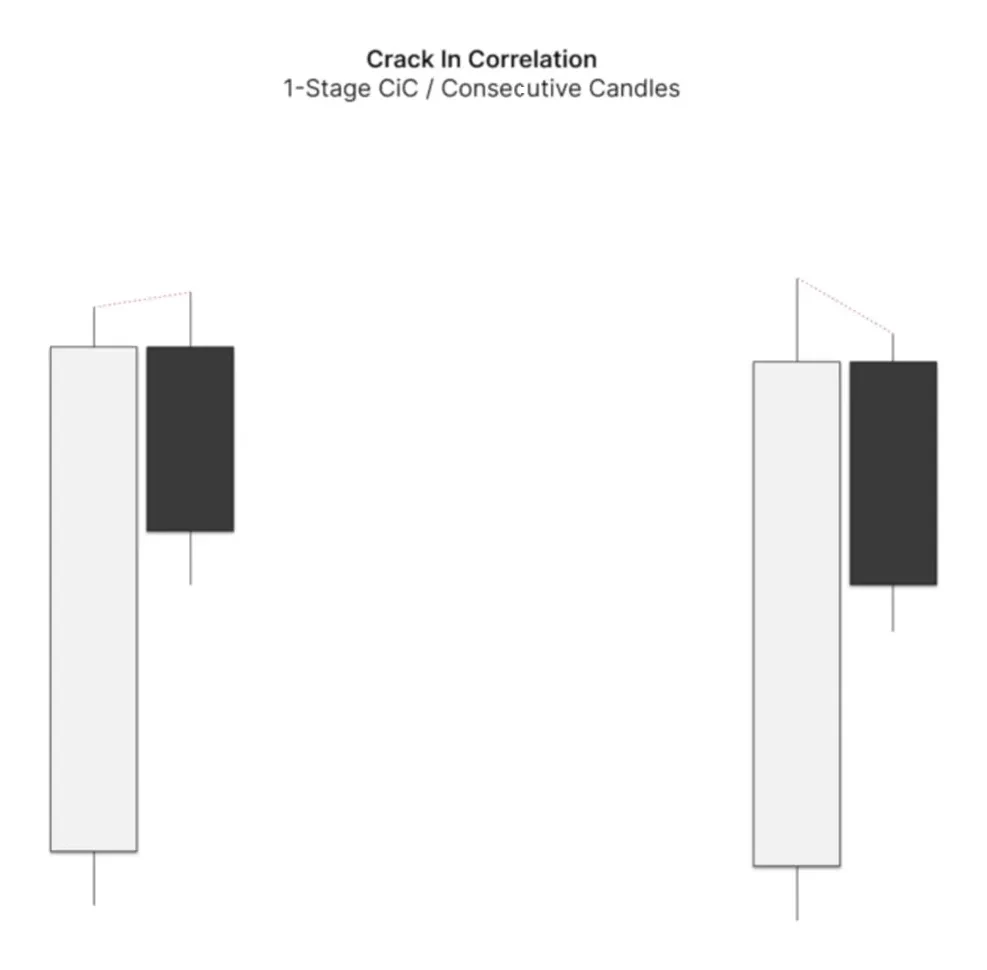
Consecutive candle SMT: one asset's candle takes the previous candle's high, the other's does not. - SMT fill, divergence within a gap. This is used extensively in continuations, covered in the next lecture, but we also draw back to it here in the context of IRL to ERL moves in the universal model.
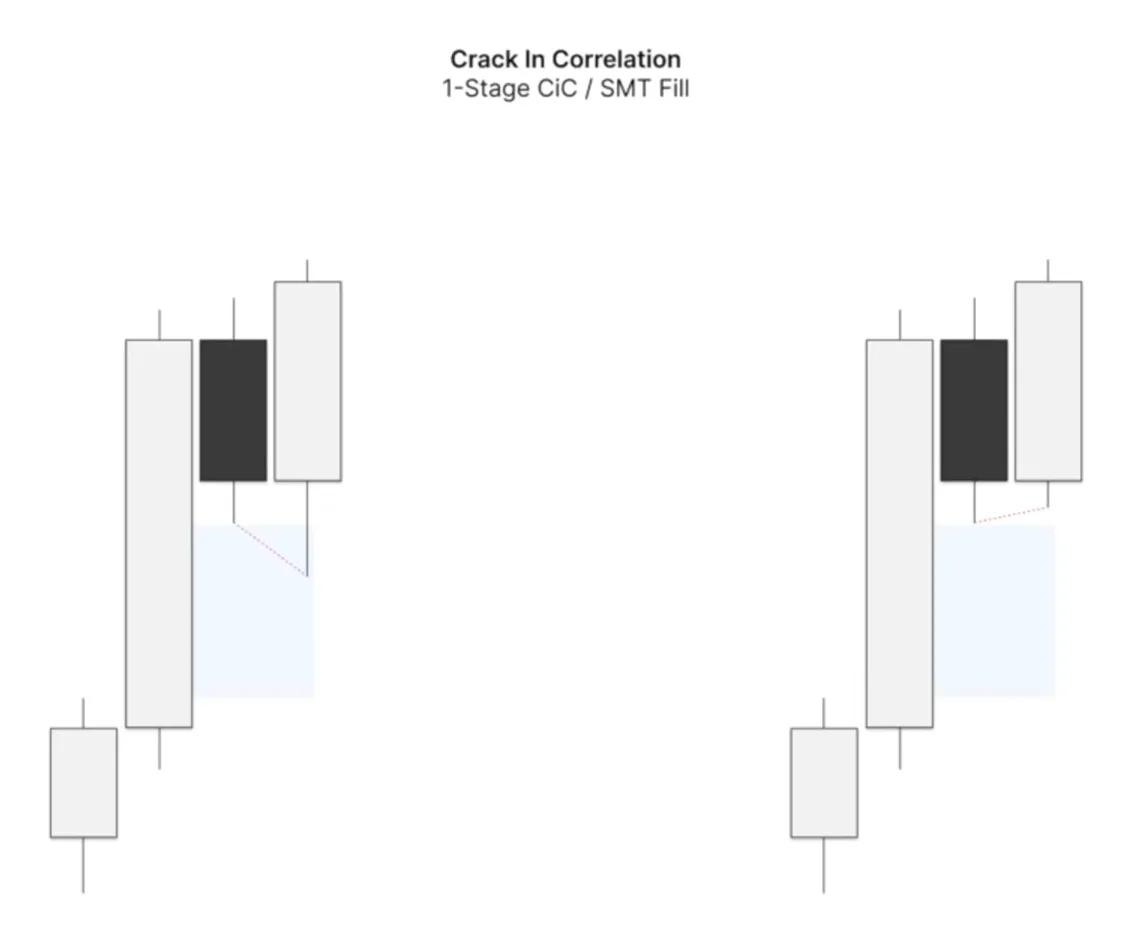
SMT fill: divergence inside the gap as it is filled. - Precision Swing Point (PSP). A crack in the correlation of the delivery closure of a higher time frame candle, or as I sometimes say, a crack in the correlation of the phase of price. One asset closes as a bearish down-close candle at the swing extreme and the other closes as a bullish reversal candle at the swing extreme.
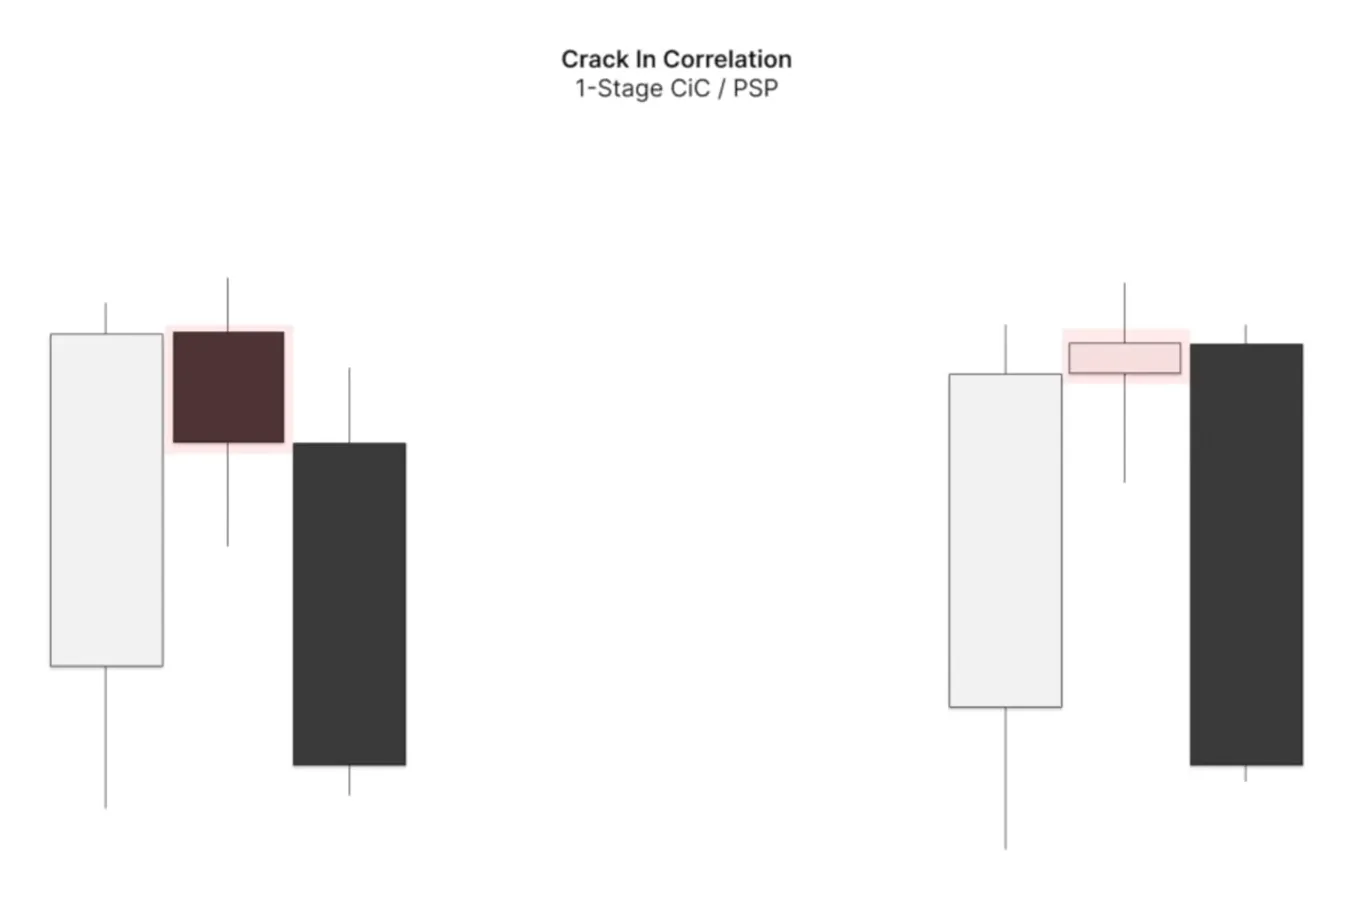
The Precision Swing Point: the two assets close their candle in opposite directions at the swing extreme.
You’ve probably got some questions...
Learn The Lathyrus Model with direct guidance from our coaches.
- 10 live streams every week
- Regularly updated in-depth course
- 450+ hours of live stream recordings
+ more
Validating SMT With Strength
Strength Switching validates all of the one-stage cracks above: PSP, SMT fill, consecutive candle SMT and SMT with swings. Whenever any of these cracks in correlation form, we need to see Strength Switching to validate that the crack is valid. We need to see the manipulating asset momentarily reversing the strongest. I think about it through two cases:
- The asset, or assets, that make the higher high reverse lower with relative strength.
- The asset, or assets, that make the lower low reverse back into the range faster, more energetically and with relative strength.
This is due to a phenomenon known as order pairing. If we are going to reverse off a high that has been diverged at, we need to see the asset that sweeps the high in that universal model show displacement lower and a willingness to order pair the high and move lower, while the asset that creates the failure swing respects that bearish order flow and also trades lower momentarily. A Strength Switch of the manipulating asset confirms the SMT is valid.
We can observe Strength Switching in a few ways:
- A Precision Swing Point. For example, an asset that trades higher into the range, forming an SMT, closes as a PSP. The stronger asset becomes momentarily weaker after sweeping a high or low.
- A larger displacement after reversing, for example fair value gaps.
- A time-based filter: a faster reversal, in the form of a faster change in the state of delivery.
In the example, when an asset sweeps out a high this is an SMT with a swing. The asset that trades highest in the range, sweeping the external, closes as a down-close candle. That is Strength Switching, known as a Strength Switch Precision Swing Point. Likewise in an internal to external model, the asset that runs highest into the gap closes as a down-close candle, while the correlated asset is the opposing color, an up-close candle. It drives higher and then closes as the weaker candle. Flip these for the bearish case.
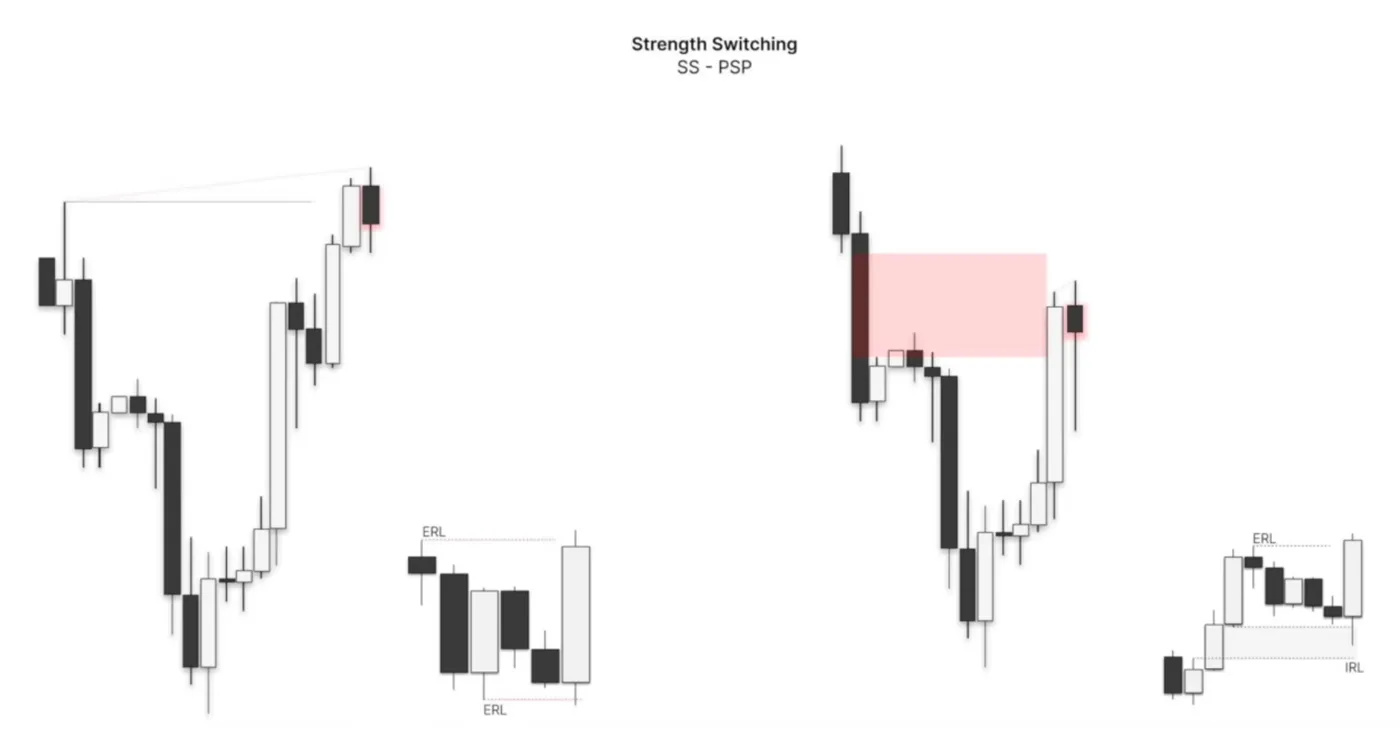
2-Stage Cracks In Correlation
Now the bread and butter, how we qualify true reversals. These second-stage cracks build on the one-stage cracks we have just been through.
- 2-stage SMT with swings. Price creates an SMT, and then creates an SMT again with the swing point that was previously diverged at. This is a true reversal signature.
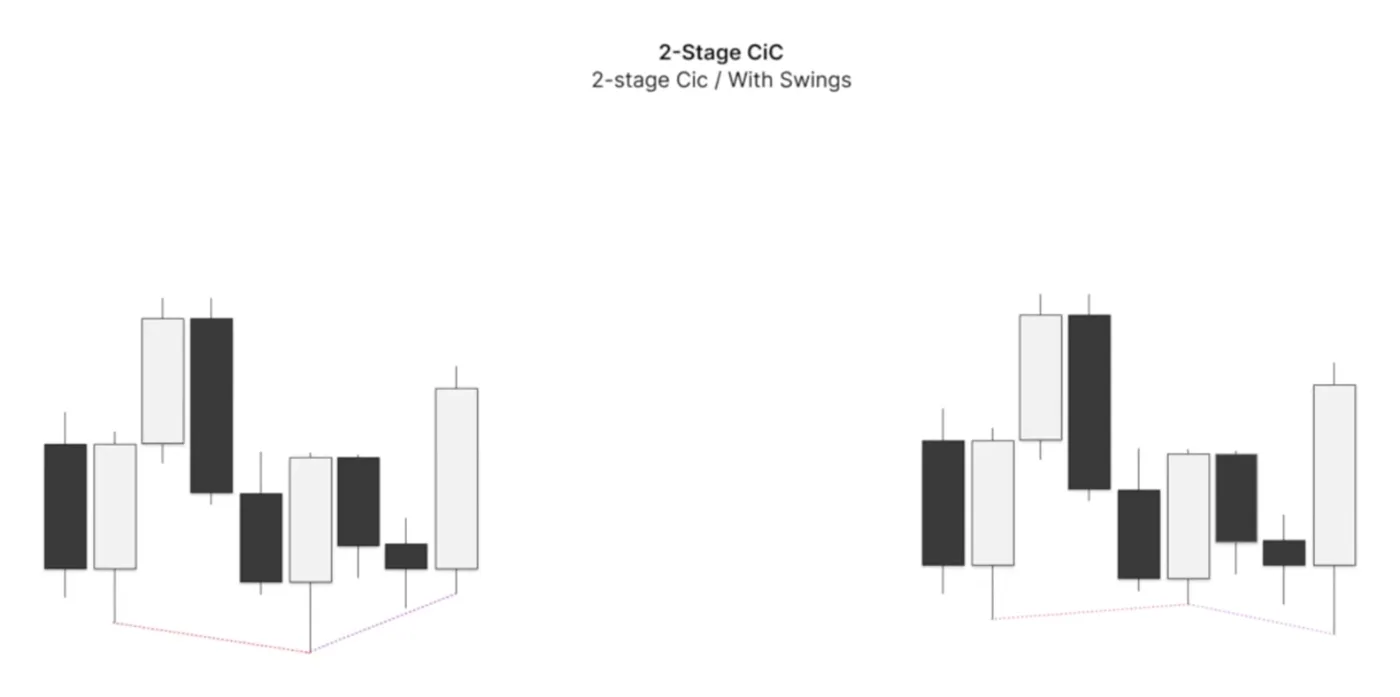
A 2-stage crack in correlation with swings: the second SMT forms against the swing that was already diverged at. - SMT confirms PSP. The first crack is a Precision Swing Point forming at, say, a range high, a range low or a fair value gap, and then a second-stage crack of SMT confirms it. In this case we can trade the candle on the asset that makes the higher high as a mechanical C2 reversal expansion, if it supports that, and we can also trade the asset that makes the lower high as a continuation, C3, or a pseudo C2 depending on how you think about it. We can trade both assets as the SMT forms, because the 2-stage crack is there: the first stage is the PSP and the second-stage SMT validates it when we get the reversal signature and Strength Switch.
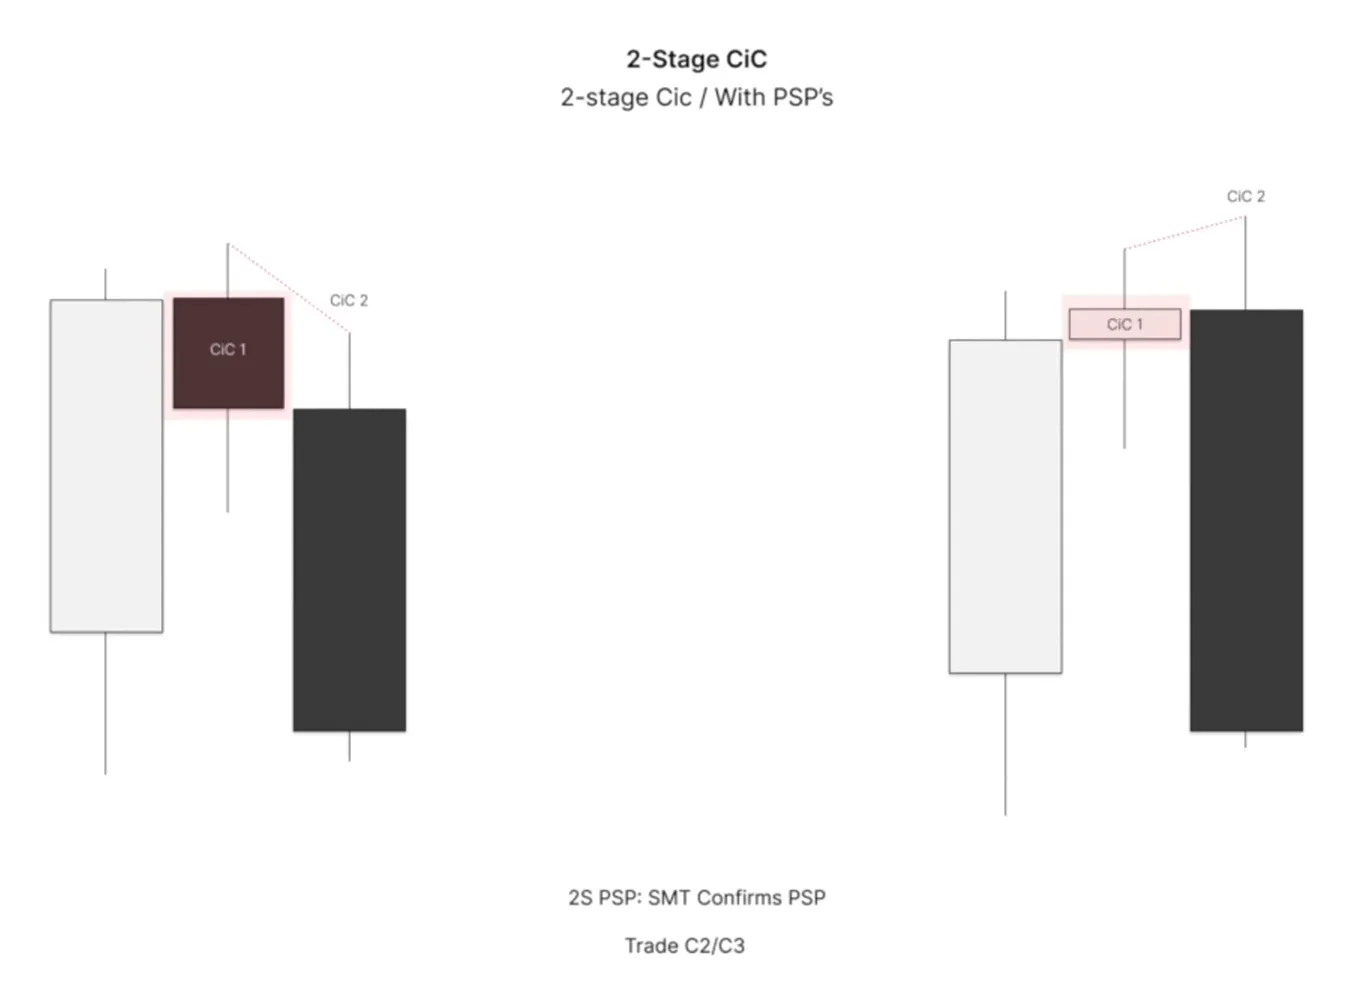
SMT confirms PSP: the PSP is the first crack, the SMT the second. Trade C2 or C3. - PSP confirms SMT. If SMT can confirm a PSP, a PSP can also confirm an SMT. The first-stage crack is an SMT, a single phase of crack in correlation, and the closure of Candle 2 confirms the swing with a PSP. In this case we look to trade Candle 3 lower, the next candle, because we need to see the two stages to validate a true reversal.
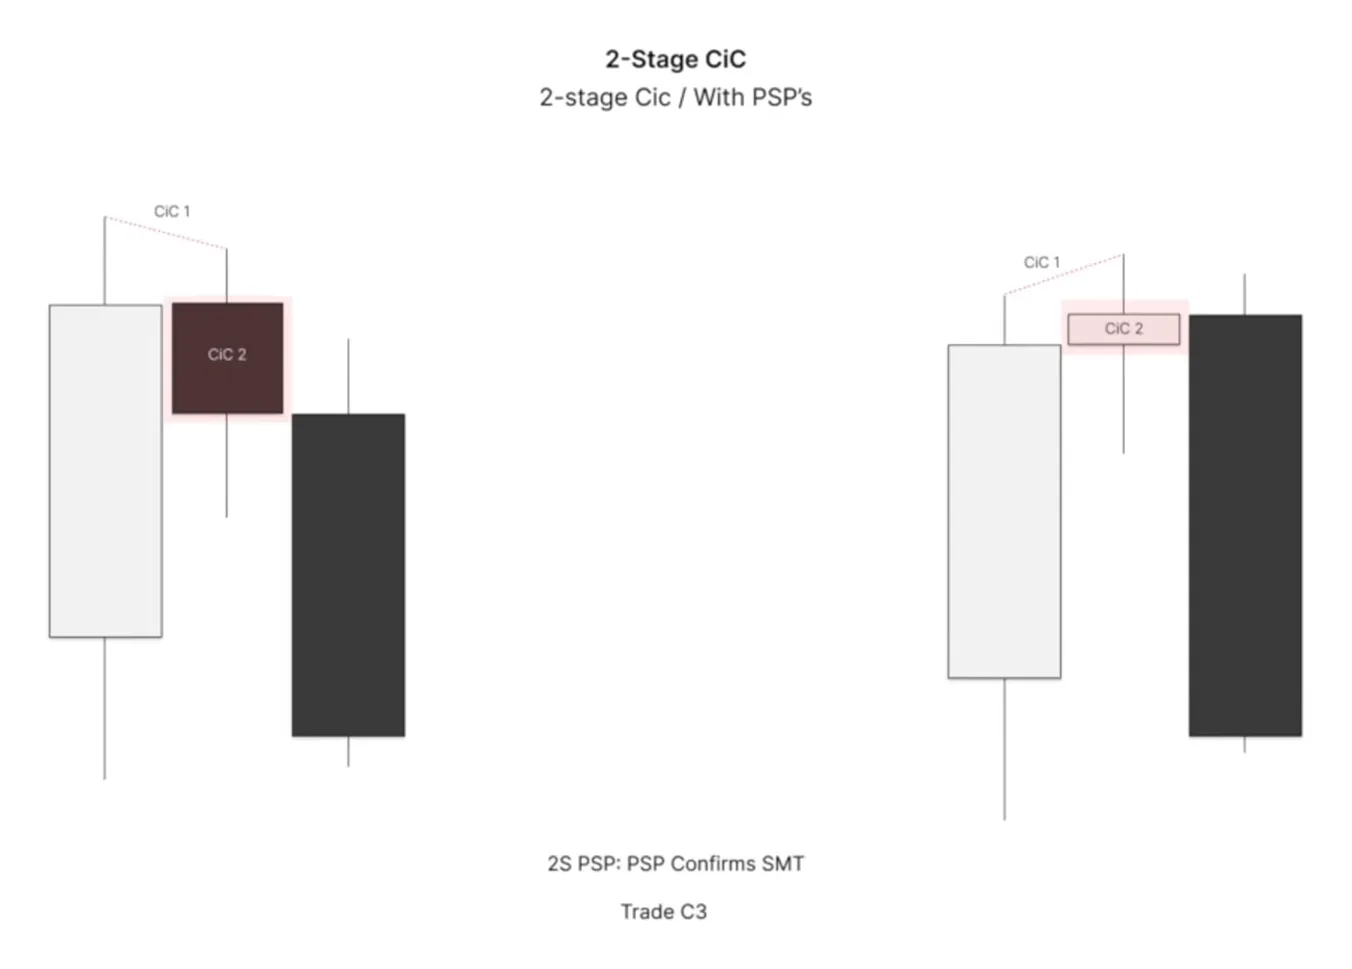
PSP confirms SMT: the SMT is the first crack, the PSP closure the second. Trade C3. - Variations involving 2-stage PSPs and SMTs. A 2-stage PSP formed with a swing of an SMT, a PSP plus a swing. There is also a three-stage, which is the same thing: a 2-stage PSP and then a 2-stage SMT. These are just variants involving swings and Precision Swing Points, multiple cracks in correlation. The logic is what matters: a 2-stage crack forms the reversal candle.
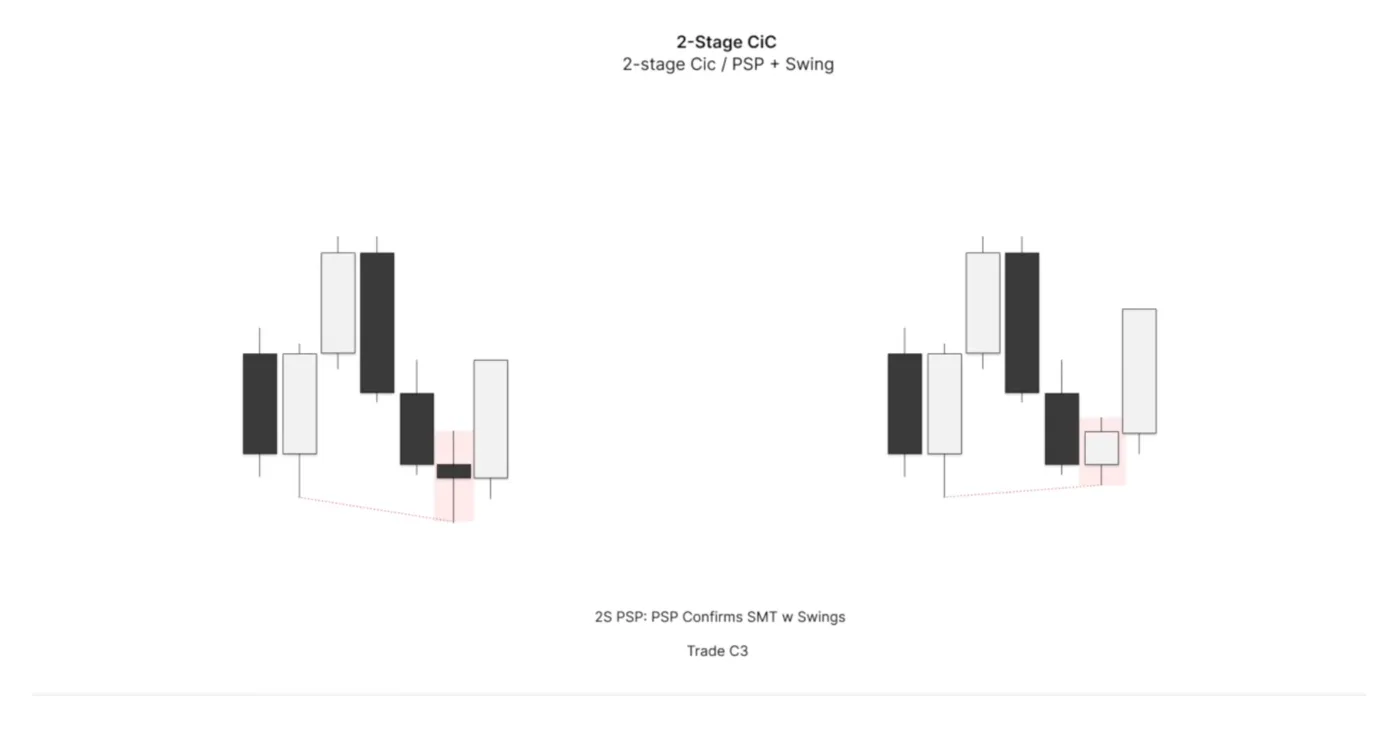
A 2-stage PSP with a swing: the PSP confirms the SMT with swings. Trade C3. 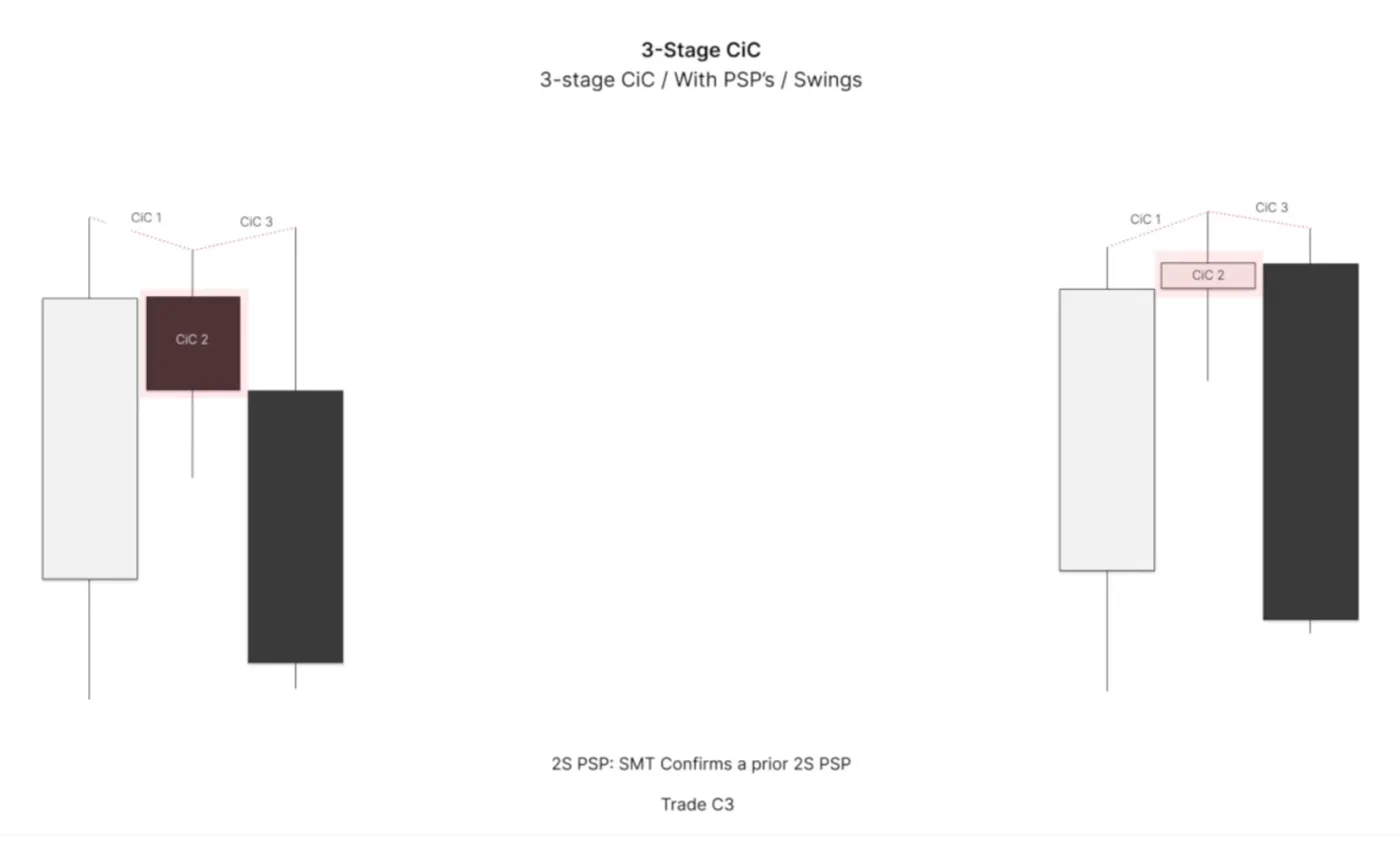
A three-stage crack: an SMT confirms a prior 2-stage PSP. Trade C3.
When you are expecting something like a three-stage crack, where a 2-stage PSP forms and then one asset runs out the high, see whether the candle that forms the third crack has a driver. A driver can form that high because there is a lot of volatility. Or check whether the previous candle closed above Candle 1, in which case Candle 2 did not close as a reversal candle, and sometimes the third candle sweeps the high. Around drivers and based on that Candle 2 closure you can expect a three-stage to form: Candle 2 does not reverse and give the swing, and the next candle creates a new manipulation. Don't overcomplicate it. These are just the forms of SMT divergence, or cracks in correlation, that form.
So now we are building in a logical order. Swing formations are Market Maker Models, and the extremes of those swing formations within the universal model are formed with 2-stage cracks in correlation. That is what answers the earlier question: how do we know this C2 is going to hold, how do we know we will reverse before it closes? It is the 2-stage crack forming at the extreme of the Candle 2, seen in the context of the lower time frame reversal signature and how that fractal forms with the higher time frame.
Type 1 Synchronized Reversals
We introduce two types of sequence. A Type 1 sequence is a simple reversal where all assets reverse at the same time: they form SMT and that SMT leads to a reversal with a crack in correlation. A Type 2 reversal uses a concept called asset synchronization, which involves SMT break logic, where assets create swing highs and lows at different times or deliver in opposing ranges. We will cover the algorithms for those afterward.
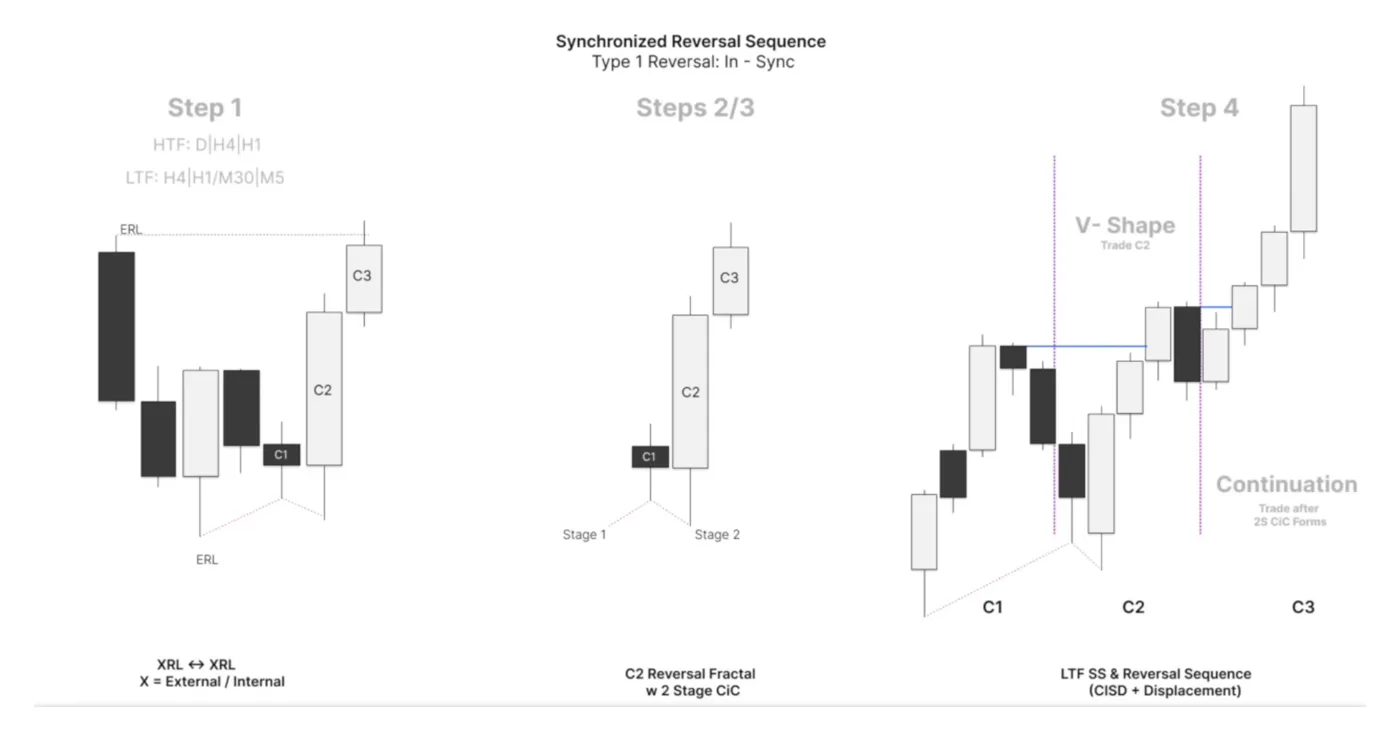
A synchronized reversal sequence, the regular reversal, has four steps:
- The triad trades into a key level: a swing high, a swing low or a fair value gap, either ERL or IRL.
- A 2-stage crack in correlation forms at that key level and creates the C2 or C3 swing formation we studied. This is the unique element our analysis focuses on.
- A form of Strength Switching away from the 2-stage crack. The asset that manipulates higher or lower gives one of the Strength Switching signatures we discussed.
- All assets expand and reverse together.
Learning it alone isn’t easy...
Learn The Lathyrus Model with direct guidance from our coaches.
- 10 live streams every week
- Regularly updated in-depth course
- 450+ hours of live stream recordings
+ more
Chart Examples Of Type 1
This is the master class in reversals. If you look at my trades, 90% of the reversals look like these prototypical examples.
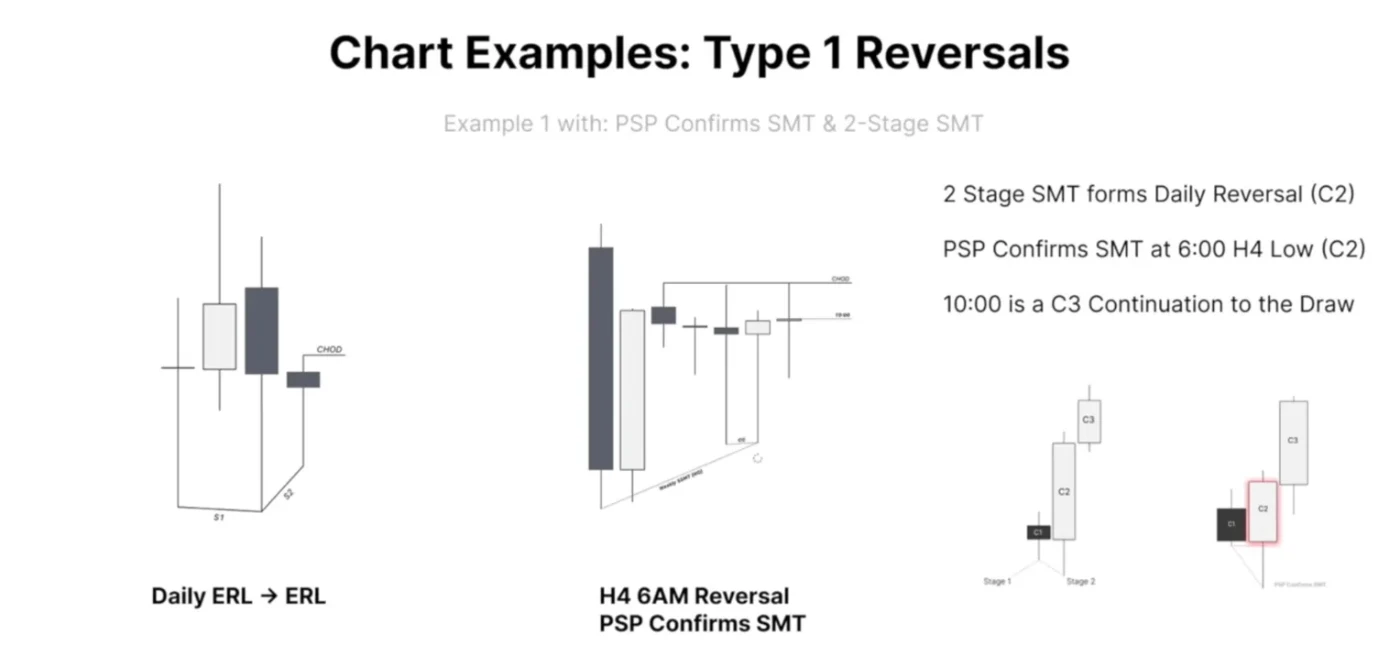
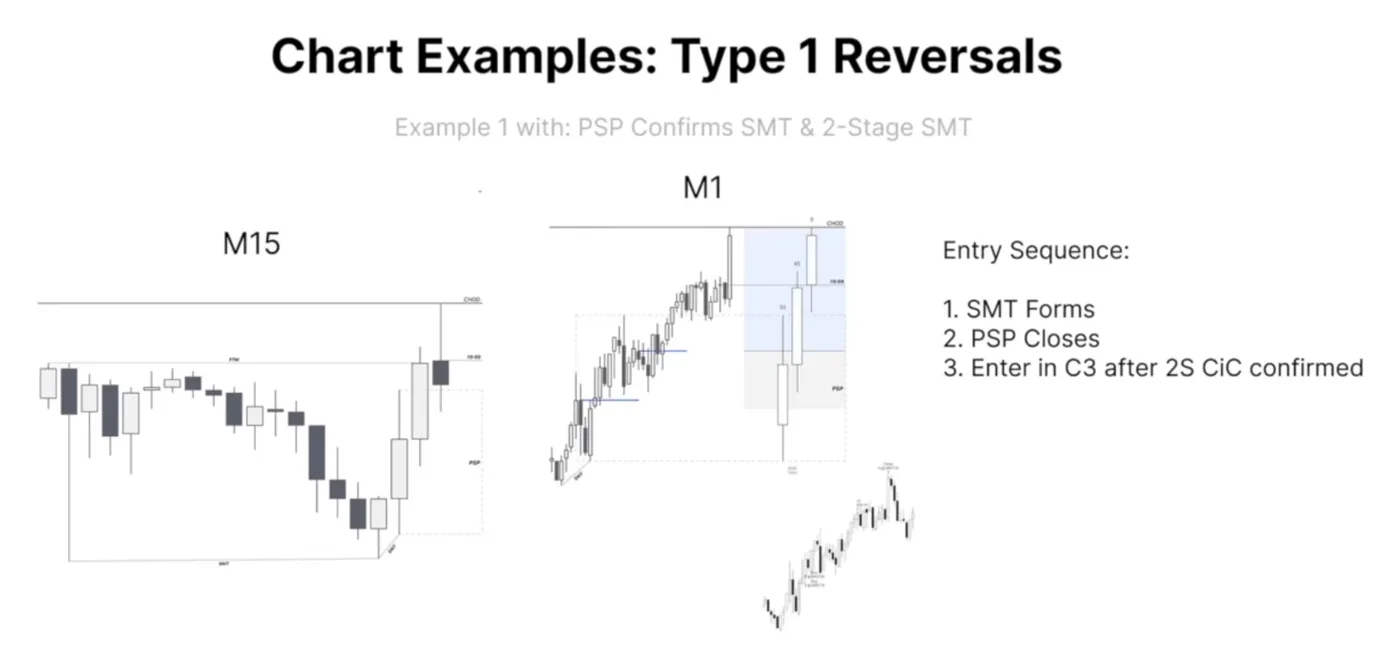
Example one: PSP confirms SMT. Define a universal model, here an order paired range, ERL to ERL, though it could be any universal model. A PSP confirms an SMT, a variant of the 2-stage crack, at the low of Candle 2. One asset in the triad forms this signature into the key level. Because the 2-stage forms when the PSP closes, we do not trade Candle 2. We wait to trade Candle 3 once this candle confirms the low with the 2-stage, and then trade the continuation. In cases where PSP confirms SMT, I wait to see the candle close. At other times, if I know it will close as a PSP, I may enter in C2 if enough signatures are given, specifically the V-shape and maybe a fair value gap continuation within Candle 2. But typically I like to see the PSP candle close and then trade C3 as a continuation, which is when the wick is formed: you have an order block and you can get involved. That wick forms from the lower time frame dynamics. If C2 is a 4 hour candle, we look for the next candle, C3, to open and come into a 1 hour or 30 minute gap, or opposing run, and trade away from that.
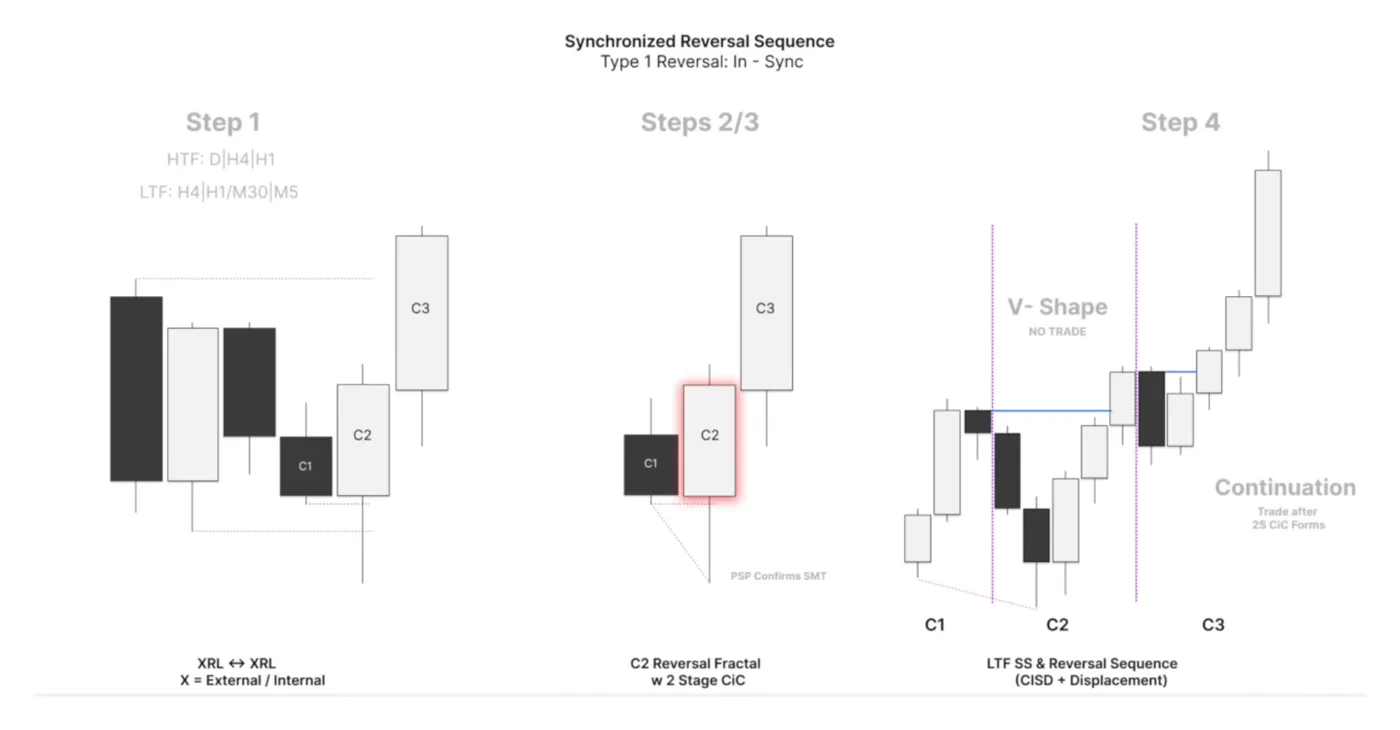
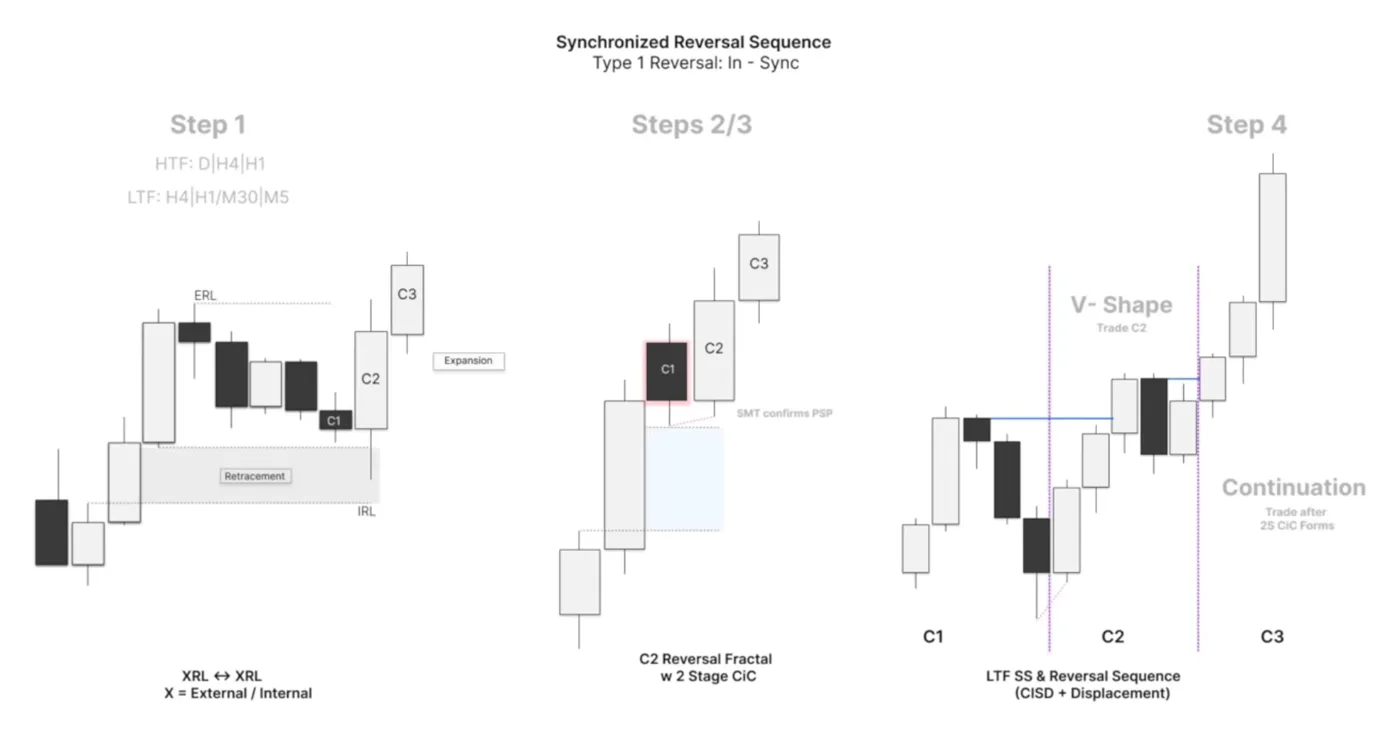
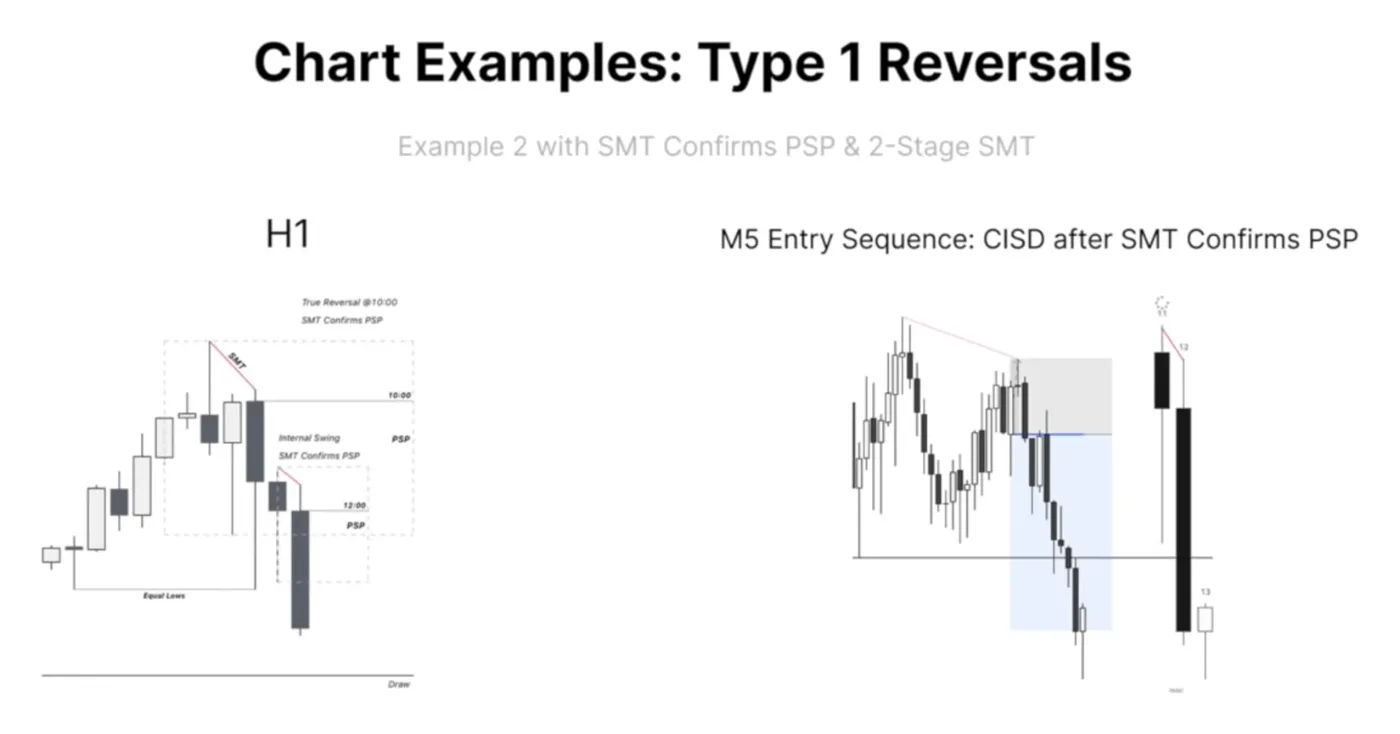
Example two: SMT confirms PSP, a C2 I would engage. This is a reversal expansion I want to get involved in. Price trades internal, we get a nice reversal expansion with a relatively small wick and a large body, and we have SMT confirming the PSP: the fractal is created with a PSP for Candle 1 and an SMT of Candle 1 with the correlated asset in the triad. Once I confirm the Strength Switch signature, maybe we expand higher and I can take entries in the order block or the CISD, take a propulsion block inside the candle, or wait for Candle 3 and trade a continuation. These are always the universal sequences, reversal into continuation. But I will engage C2 and trade it if I have the right signature, which is this candle being a C2 reversal expansion candle.
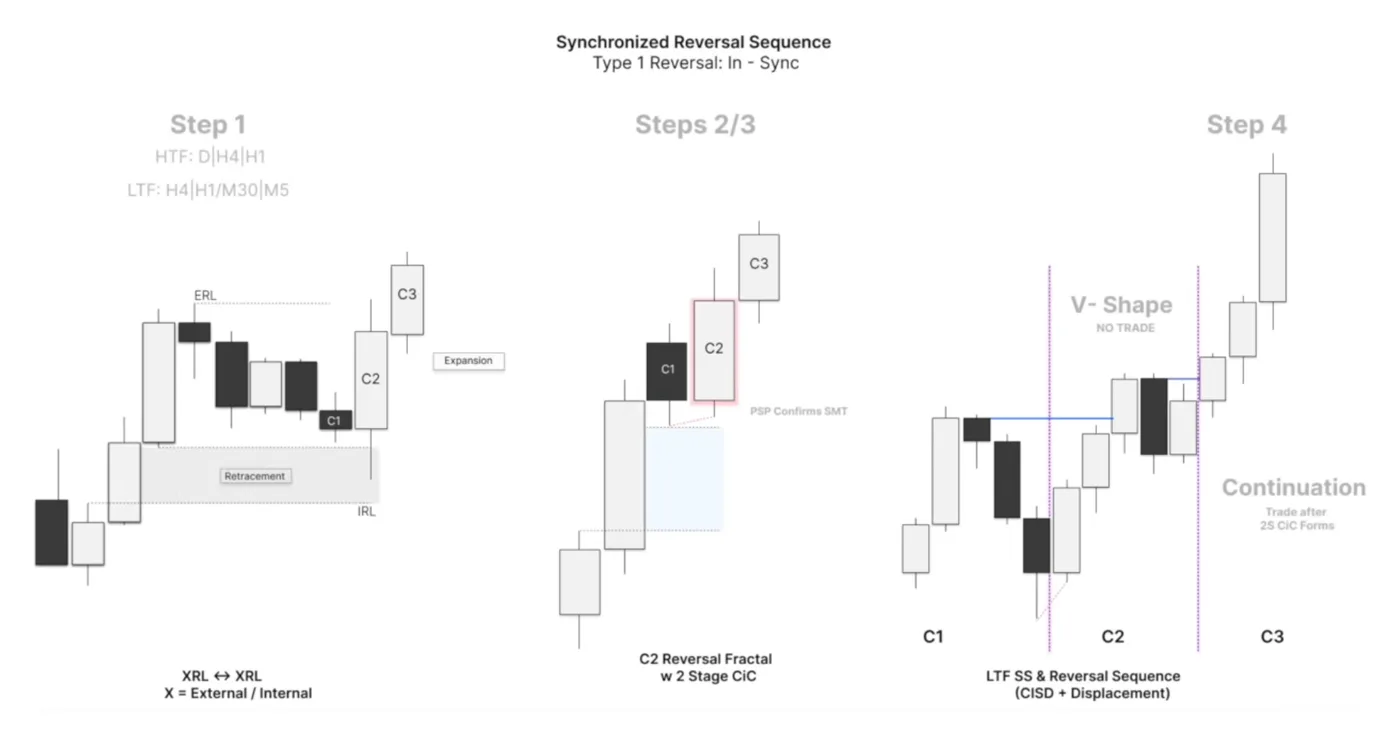
Example three: PSP validates the SMT at the close. Another internal range of liquidity example. Candle 2 closes as a PSP, which validates the SMT with Candle 1. Here, as I said, I just wait for the candle to close, for the reversal to print, and trade the continuation, because that is when the 2-stage is confirmed. When it sweeps the low, if I get the expansion higher I can say I want to trade that candle too, but where the PSP is the confirmation I like to see it close to validate the SMT. That is a preference of mine, and something I use regularly: the hierarchy of waiting for Candle 2 to close if it is a PSP.
Example four: a 2-stage SMT, no PSPs. Another order paired range, external to external. Candle 1 diverges at the external low with one asset in the triad, so this could be a reversal candle. Then C2 forms a 2-stage where this asset makes a lower low and the other asset makes a higher low. That is our 2-stage divergence and Strength Switch confirmation. What we want to see is the expansion. Once the extreme of Candle 2 forms with the 2-stage SMT, we go to the lower time frame, whatever it is, and take our entry inside the candle or trade the continuation. Say we expand and create a gap in the 30 minute or 1 hour, then the next 4 hour candle opens into the gap and we create a fractal inside that gap. Very simple. We can take that in Candle 2 or Candle 3.
From my own charts, example one. A daily ERL to ERL. A 2-stage forms at the range low on one asset, I believe ES in this case. On the lower time frame, the wick that forms the 2-stage on the daily is confirmed with a 2-stage on the 4 hour: the PSP confirms the SMT of the daily low. When PSP confirms SMT, I can trade C3 toward the highs, external to external.
Look at the entry sequence. The low of that 4 hour candle is created with a 15 minute 2-stage and a PSP of its own. We are using the time frames in continuity: a true reversal of the daily candle with a 2-stage SMT, a true reversal of the 4 hour candle with a 2-stage PSP, and a true reversal of the 15 minute fractal that forms the 4 hour low with a 2-stage itself. I take the entry in C3 as we trade higher. The PSP closes, we get a wick lower into the order block, I buy it and we take it at the highs. SMT forms, PSP closes, and I enter in C3, which is a continuation.
From my own charts, example two. A 4 hour Market Maker Sell Model and a true reversal of the daily high: an order paired range, the daily high to the daily low. We have a true reversal up there on the 4 hour and then we distribute lower. We get a reaccumulation inside a gap, which I will cover in the future, expand lower and fail to manipulate, which is a continuation signature. We retrace and that is the redistribution fractal, which I traded on ES.
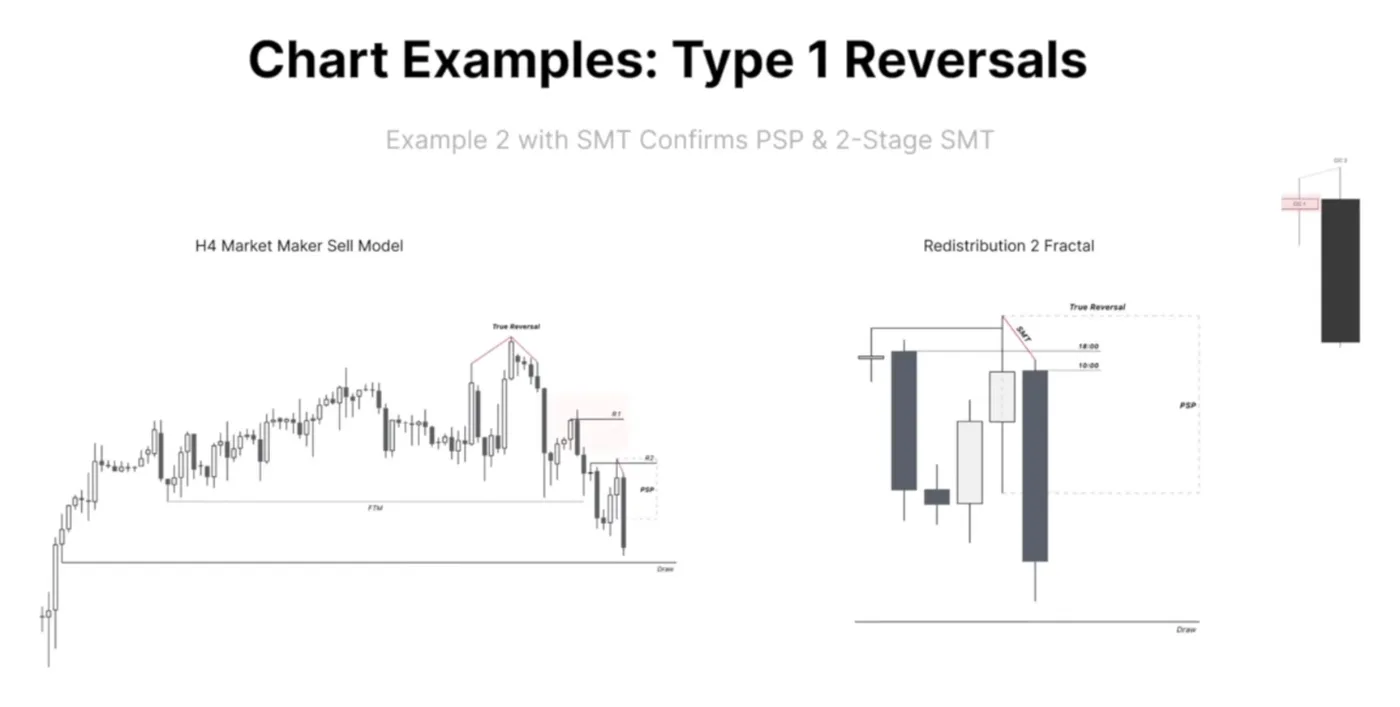
On the 4 hour we get an external to external move, an order paired range. The high at 6 a.m. is formed with an SMT confirming the PSP, a true reversal. I did not trade that reversal fractal, I allowed it to form. After the SMT confirms the PSP up there, the 4 hour candle is in expansion and I get a new internal swing, a new true reversal: an up-close candle on ES and down-close candles on NASDAQ and YM, an SMT confirming the PSP. I took the 5 minute CISD down to the equal lows and toward the draw. I could have traded the true reversal on the hourly, the SMT confirming the 4 hour PSP, with an hourly fractal. I simply took the continuation later in the day, which was a new reversal, a higher time frame continuation.
That candle was a new 6 hour candle. Just as the 4 hour high and daily high are created with a 4 hour 2-stage, the 6 hour high is created with an hourly 2-stage. The extremes of Market Maker Models, here internal to external, are created with a 2-stage crack in correlation. That is how we know the swing has formed.
Filtering Reversal Candles
These are the takeaways, the bread and butter of trading reversals. We filter Candle 2 by price, by time and by crack in correlation.
- Price filter. If there is a small wick, trade C2 as a reversal expansion. If there is a very large wick, wait and trade C3, because the invalidation is so far away with that large protraction phase that we would have to cover all the way to the low. Our stop loss wants to be at the true invalidation for the reversal. So we wait for Candle 3 to form a continuation, which it often forms as a lower time frame true reversal.
- Time filter. If there is sufficient time to expand, trade C2 as a reversal. If there is insufficient time, wait for C3 to form its wick and trade the continuation.
- Crack in correlation, the most important logic in the hierarchy. If there is a 2-stage crack in correlation, whether SMT confirming PSP or PSP confirming SMT, we can trade that C2 reversal. If there is no 2-stage crack yet, which is the variant where the Precision Swing Point closes to validate the SMT, we wait and trade Candle 3 as a continuation.
Putting it together: where SMT confirms PSP, or there is a 2-stage SMT, trade Candle 2 as a reversal expansion if it has a small wick and sufficient time to expand. If it does not, trade C3. Also trade C3 where the PSP confirms the SMT. And if there is no 2-stage crack in correlation to confirm a swing, I will not trade that fractal, as it is not a true reversal.
These invalidations are pivotal in understanding when I trade reversals, when I trade continuations, and when I do not trade at all.
Type 2 Asynchronous Reversals
Type 2 reversals are asynchronous in some way, or involve opposing delivery and SMT breaks. This is where we introduce asset synchronization, and there are two algorithms: foreseen distribution and manipulation, and middle asset SMT break into reversal.
With asset synchronization, the key dynamic to consider is a failure to manipulate, and SMT breaks. The leading asset trades into a key level in the universal model, and this is said to be decoupled expansion. Algorithm 1 typically presents itself on the 6 a.m. 4 hour candle: when the stock market opens at 9:30 you generally see one asset, maybe the NASDAQ, expand in one direction, while the ES and the YM expand the other way. Two assets move together and one asset in the triad moves to the opposite side of the range.
Whichever asset fails to manipulate the key level, the range high or the range low, is said to be in foreseen distribution. Why does a failure to manipulate matter? At this point we do not know which direction the triad will go. Recall the critical point from the start of the lecture: assets expand in sync, and when they are out of sync, one or more of them is manipulating. We do not know which ones until we see a failure to manipulate.
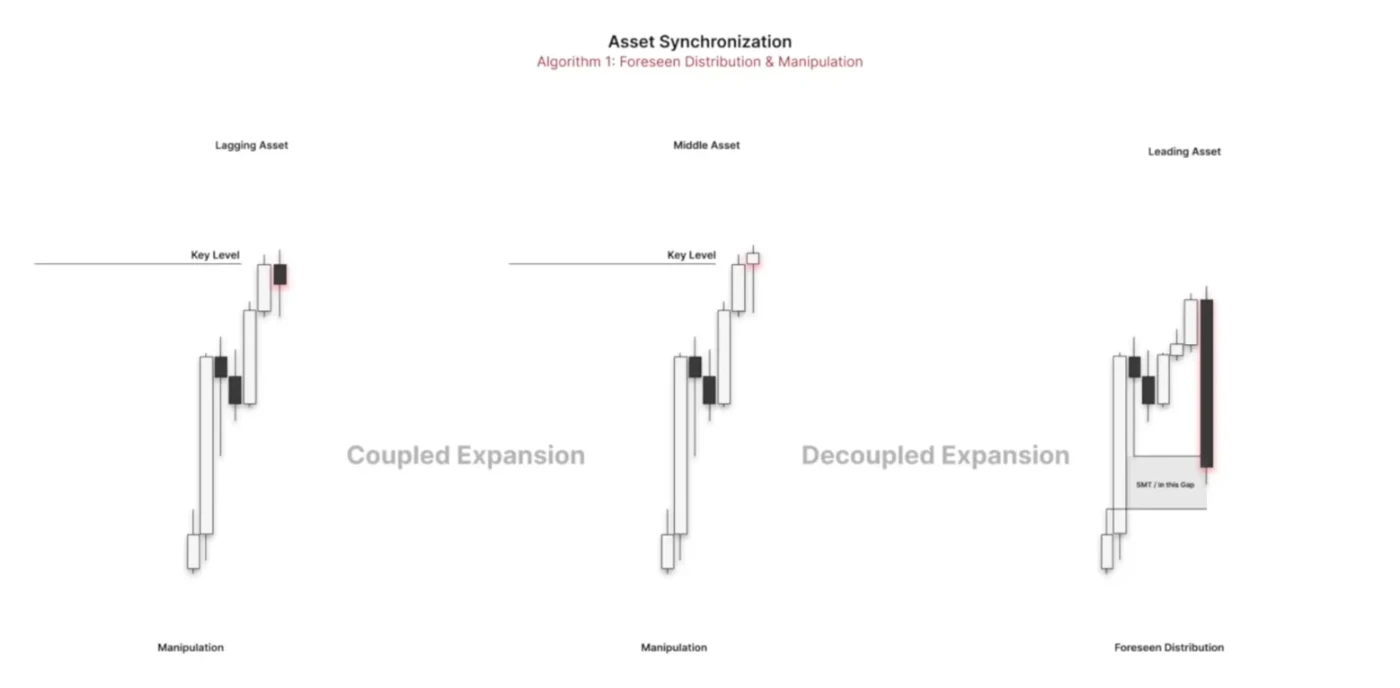
Algorithm 1: foreseen distribution and manipulation. In the example, the 6 a.m. candle on YM closes as a bearish 4 hour candle into the key level, the gap, so external to internal. The other two assets run the external high, forming SMT with that range level, and then form a bullish up-close candle and a bearish down-close candle. That is the crack in correlation forming the swing point, a PSP, and then a 2-stage PSP.
What is important in this algorithm is that the leading asset lower, the one that distributed lower, fails to reverse inside the key level, whereas the other assets, which were manipulating, show a reversal signature: a 2-stage crack in correlation while manipulating a key level. You will see that price signature time and again when you see decoupled expansion.
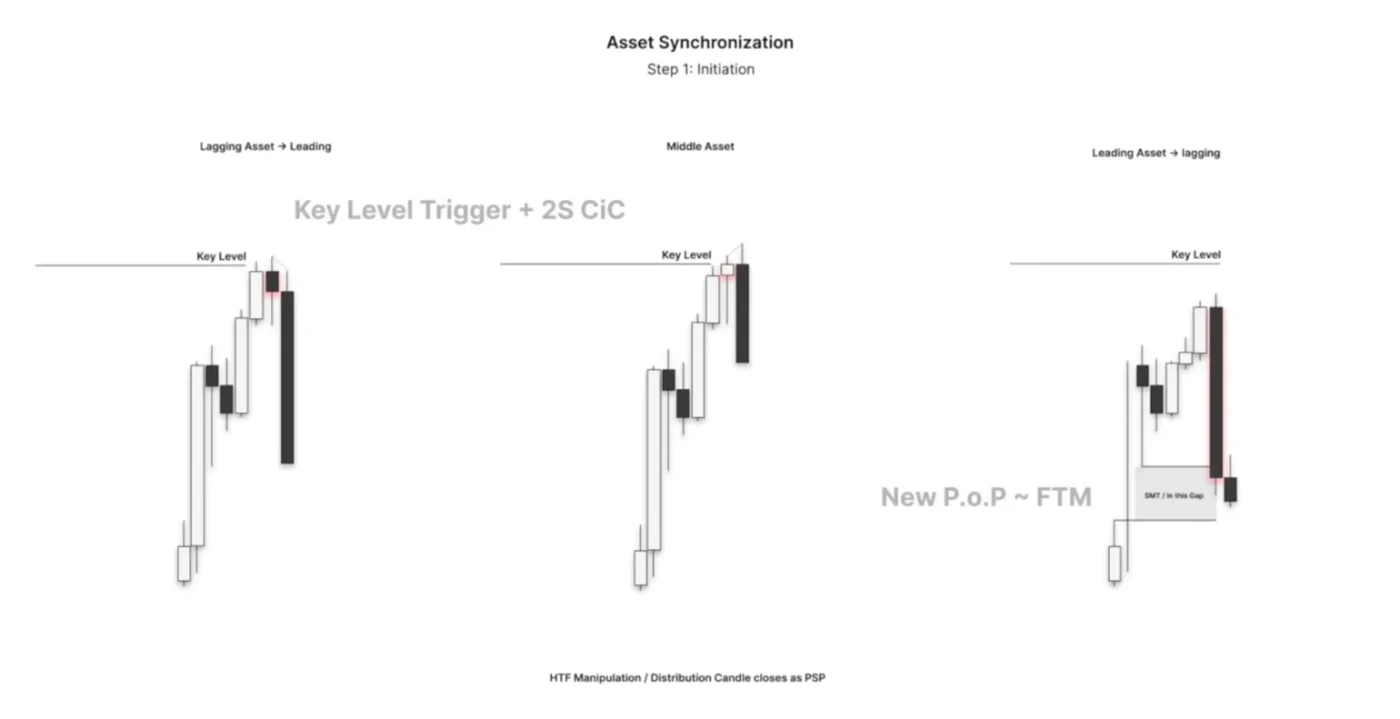
How do we trade the SMT break? 6 a.m. closes at the low and fails to reverse, then 10 a.m. is in continuation on that asset. Meanwhile it is consolidating or retracing near the opening price, a new phase of price that is not reversal, while the other assets expand lower to break the SMT. They are breaking the SMT low, meaning they are catching up, which is a form of Strength Switching.
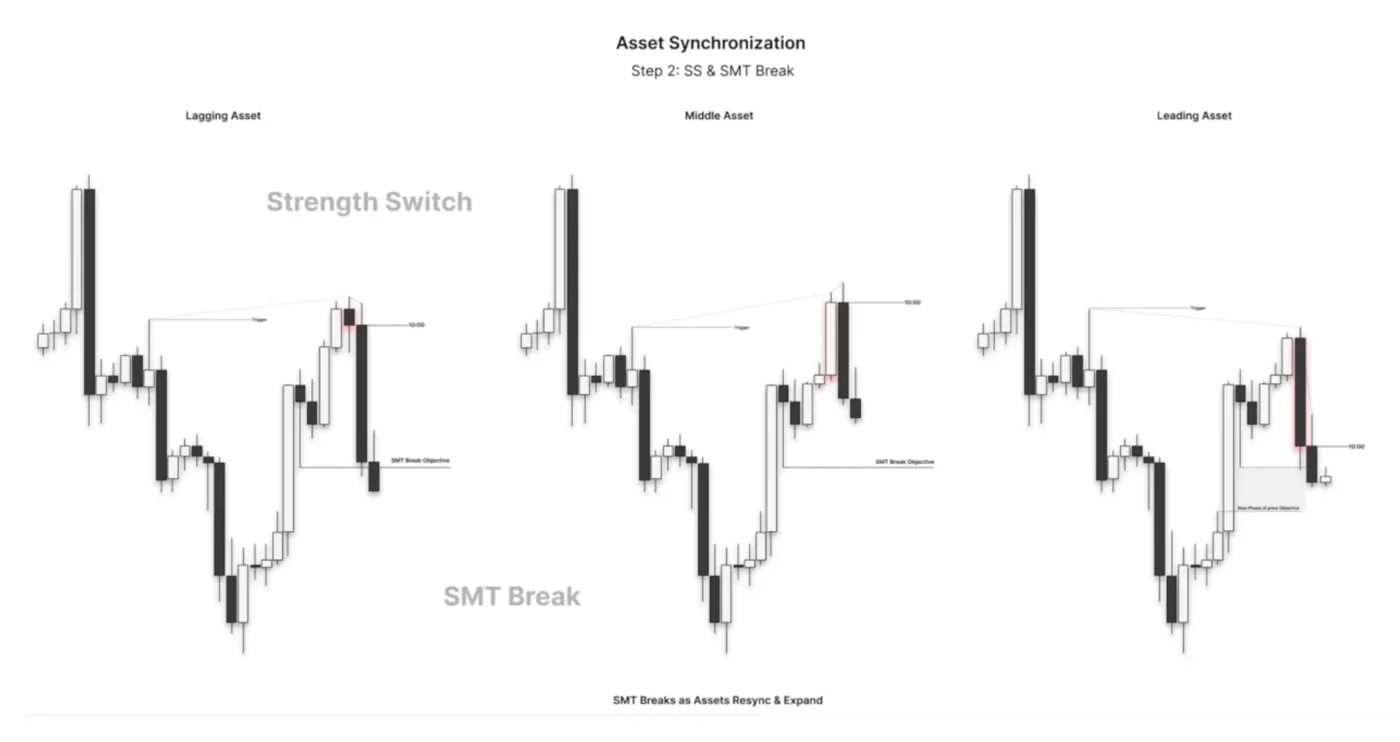
The trigger could look like a 2-stage PSP, a 2-stage SMT with a 2-stage PSP, or just a 2-stage SMT, or simply the lower high. These are all the 2-stage variants we talked about. The most important thing to recognize is the Strength Switching: the assets that trade higher in the range switch strength and trade lower. A bullish up-close candle into the key level, then a close down. That is the Strength Switching you will see on the lower time frame, often accompanied by a faster CISD and imbalances forming, with the PSP being the obvious example, while the other asset fails to manipulate.
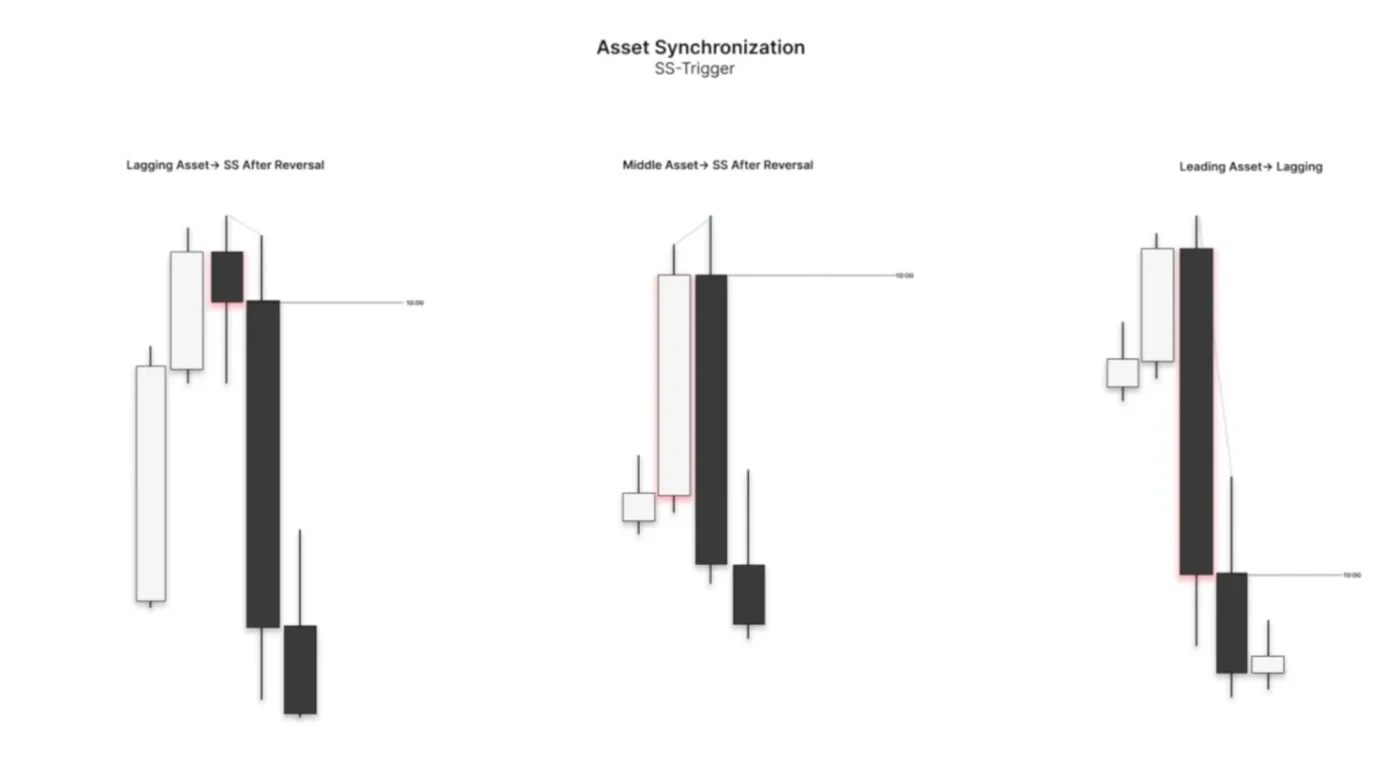
This is a typical trigger that you will see all the time, and you can go and backtest it. Most of the time when we see this algorithm, 6 a.m. expands and forms a PSP on the two assets that take out the highs, the foreseen distributing asset closes as a down-close candle, we form a 2-stage PSP of some sort or a 2-stage SMT, and the others catch up in the next candle at 10 a.m. The leading asset just holds in a holding pattern, waiting for the others to break the SMT. The reversals happen at different times: this asset already reversed and is now consolidating or retracing, and the others now need to reverse, which is why we see a Strength Switch.
On the lower time frame: the initiation is the key level, the foreseen distribution and manipulation. The confirmation of the trigger, the manipulation, is a 2-stage crack on the lower time frame. The middle and lagging assets, the other two in the triad, mechanically reverse after that 2-stage crack is formed. The leading asset must consolidate or retrace a gap inside that candle. What it cannot do is reverse itself. If the leading asset into the key level reverses, this is a regular Type 1 SMT, where price comes in, forms a divergence at the range low and we all trade higher. The failure to manipulate, the consolidation or retracement, is what leads to the SMT break that eventually forms as the assets expand and reverse together.
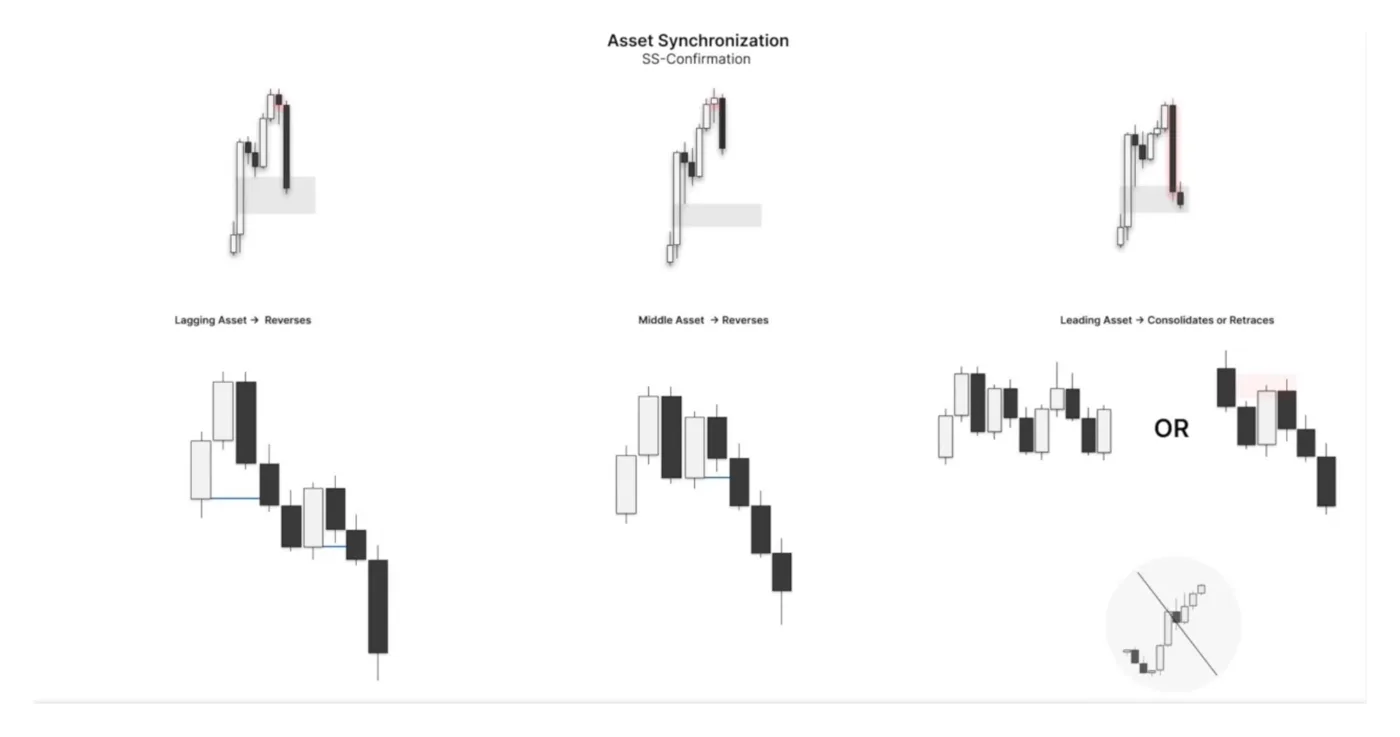
That is Algorithm 1. It really comes down to the phase of price, so pay attention to a manipulation, or the lack of one, at these extremes.
You’ve probably got some questions...
Learn The Lathyrus Model with direct guidance from our coaches.
- 10 live streams every week
- Regularly updated in-depth course
- 450+ hours of live stream recordings
+ more
Algorithm 2 And Synchronization
In Algorithm 2, the leading asset fails to manipulate a higher low, the middle asset breaks the SMT in a similar way to the previous example, and the lagging asset fails to break the high, with all three assets reversing together. This is called a middle asset SMT break into reversal.
- Initiation. The leading asset trades into a key level in the universal model: a high, a low or an imbalance.
- The middle asset forms a failure swing deep in discount or premium. Deep in discount or premium is very key here. It forms very close to the high.
- The lagging asset forms a larger range SMT.
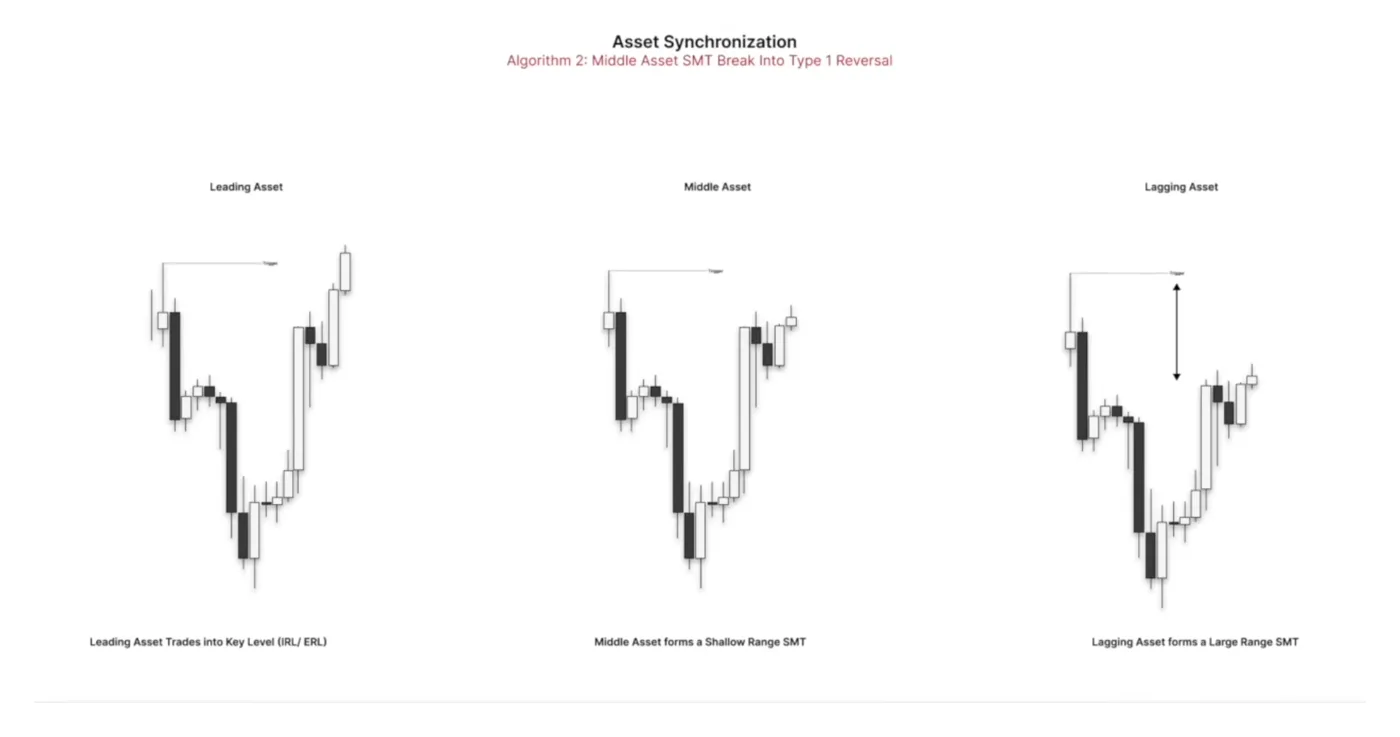
This introduces an advanced premium and discount sequence involved in this reversal type. As the leading asset fails to manipulate the high, recall that a failure to manipulate is a new phase of price: a consolidation or a retracement. As it fails to manipulate off the high and reverse, it fails to Strength Switch lower. We then see the middle asset break the SMT, which formed deep in premium or discount, and the lagging asset forms a very deep range SMT, a long way from the high, whereas the middle asset's proximity was very close.
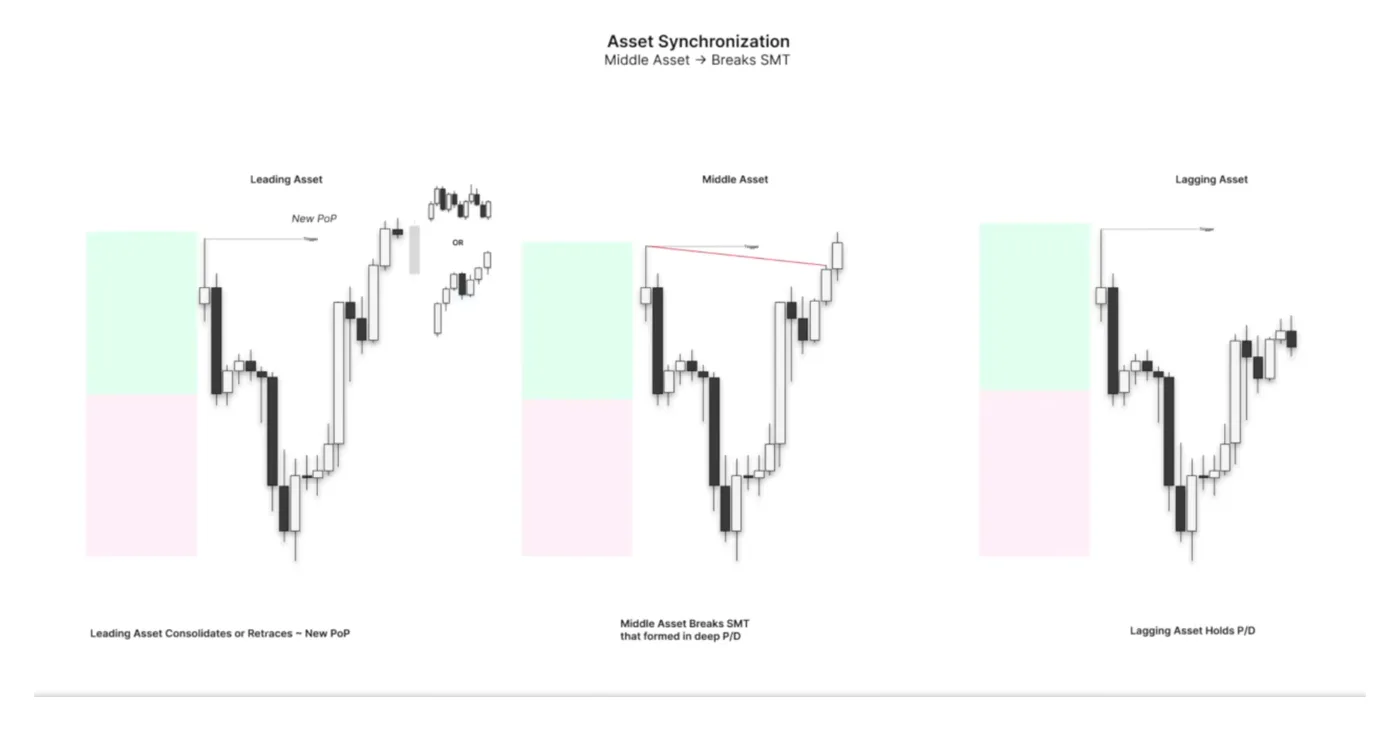
Once this sequence forms we see the 2-stage crack in correlation form, the same ones we have been talking about, a 2-stage SMT, a 2-stage crack of some sort or one involving a PSP, and then expansion that is synchronized. Remember, assets are in sync for expansion. They may be out of sync here, one consolidating, one expanding, one retracing, and then they re-synchronize and expand together. We see a form of Strength Switching, for example a Strength Switch PSP, and then expansion toward the low, where we anticipate that the lagging asset, the one that did not make the high, hits its low first, based again on its proximity to that low. For one asset this is a retracement into expansion, for the others a reversal.
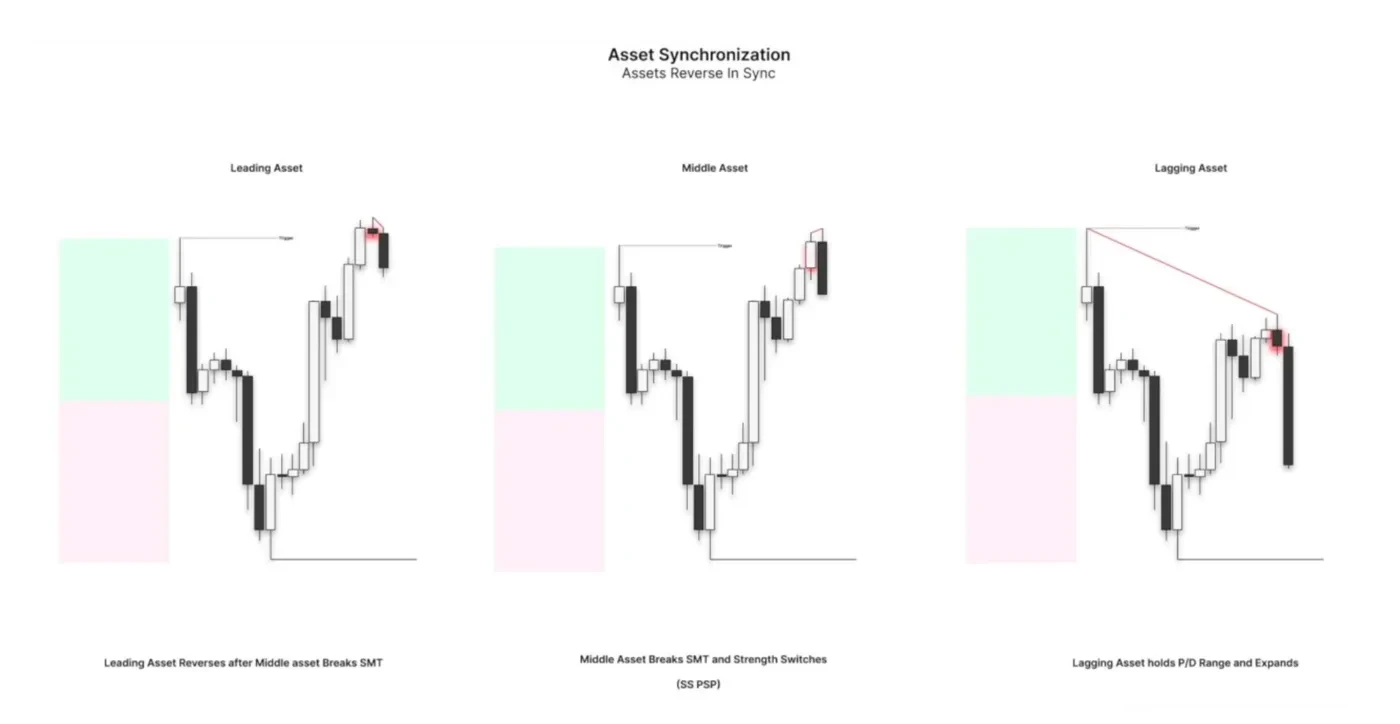
I call this a spaced-out SMT. It is a good way to describe the gap between that reversal and the new high created in the premium and discount sequence. Invalidation is if the SMT forms as a very tight failure swing, or if we fail to reverse after breaking the SMT. We need to see these assets reverse together, not continue to chop around, consolidate or retrace.
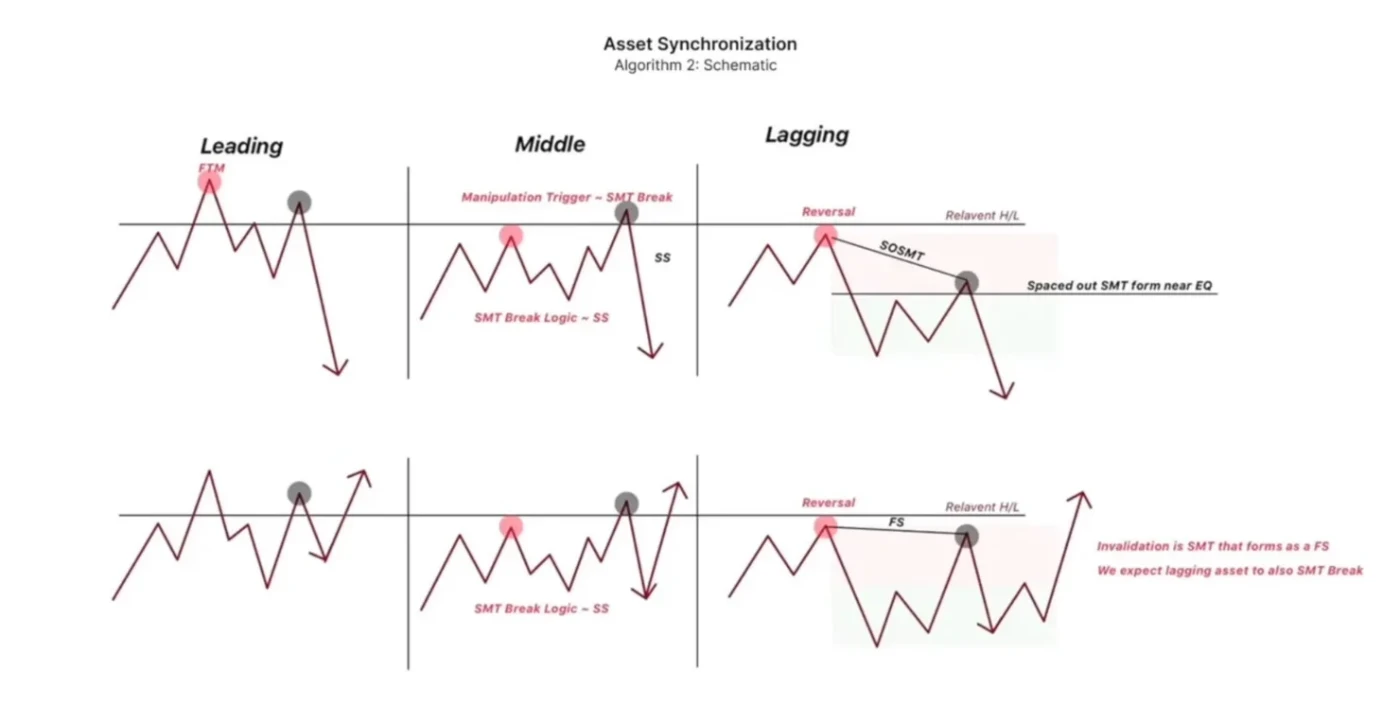
The key takeaways for Type 2 reversals:
- We filter asynchronous reversals, Candle 2s that reverse at different times or in different phases, by decoupled triad expansions and by failures to manipulate from assets that expand and then fail to manipulate.
- Algorithm 1 when they are decoupled. Typically 6 a.m. offers the decoupled move between YM, the NASDAQ and the ES. At 10 a.m. we get the failure to manipulate on the asset that expanded in the true direction, we get the 2-stage, and the other assets resync after reversing and break the SMT. Sometimes NASDAQ and ES are the true direction and YM manipulates, sometimes the inverse. What is key is the failure to manipulate. If we failed to manipulate the high, YM may trade back into that key level, and the two assets that gave the Strength Switch and 2-stage crack catch up and break the SMT.
- Premium and discount sequences when we fail to manipulate. If a leading asset fails to manipulate a high and puts in a new phase of price, and we have a premium or discount SMT forming, we can anticipate Algorithm 2, where the middle asset breaks the SMT and then we reverse.
- If the leading asset reverses, trade it as a Type 1. If in Algorithm 1 the leading asset reverses at the lows with a large SMT and a Strength Switch, or price comes into the high, reverses and forms SMT, we trade it like a regular Type 1 reversal: SMT forms, the asset that made the higher high or lower low reverses, and all assets expand. We use asset synchronization logic when the phase of price following the key level is not reversal, when SMT does not lead to reversal. What do we validate SMT with? A Strength Switch and a reversal. If we do not see the manipulating asset reversing, we assume there will be some sort of SMT break logic, whether Algorithm 1 or Algorithm 2.
Trading Manipulation Phases
When you understand this, you can start to trade the manipulation phases of price as well. In this example a relevant low has been taken, there is no true reversal down there yet, but we have a mechanical C2 closure and an all-time high level. On this day we traded the manipulation phase, the 6 a.m. candle going in opposing directions.
NASDAQ forms its high of day at 6 a.m. with a 2-stage PSP: SMT confirms PSP, the high of day. So NASDAQ is trading from its external daily high back into the range, external to internal, with 6 a.m. reaching into the fair value gap. Remember it has to be a universal model. At the same time YM is doing the exact opposite, expanding from a 2-stage that formed its low. One formed the high, one formed the low, so we can expect 6 a.m. and 10 a.m. to do exactly the first part of Algorithm 1: 6 a.m. is typically a decoupled expansion and 10 a.m. resyncs.
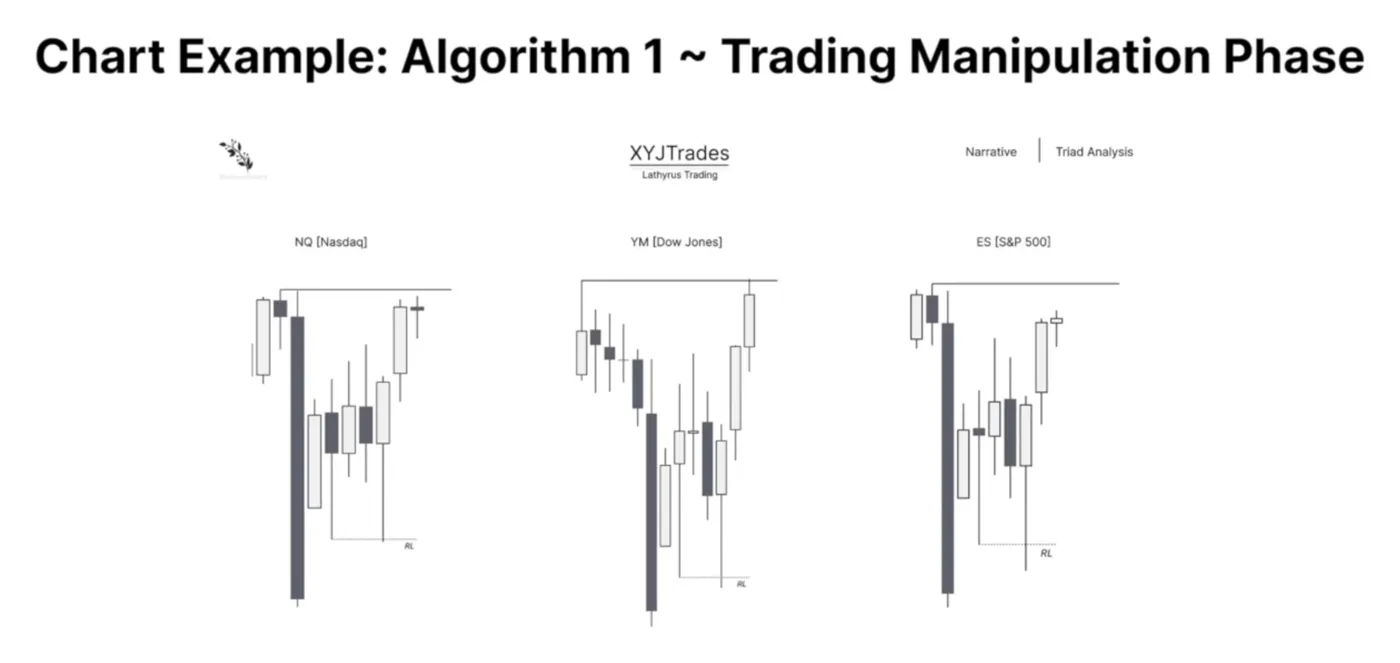
On this day I traded the 9:30 open as that decoupled move, before 10 a.m. resyncs price. How is it going to resync? We take out the all-time high and then that asset either fails to manipulate and we trade higher, or it reverses and the other asset starts to accumulate, the same logic as the other examples. We trade the manipulation phase because we understand this dynamic supports 9:30 reaching higher on one asset and lower on the other. I took both trades. I need a swing to trade, and at 9 a.m. there is a 2-stage PSP, so we sell off and trade NASDAQ into its internal draw. On YM, the 9 a.m. PSP gives SMT with the PSP, so while NASDAQ trades lower we get the SMT confirming the PSP and trade YM higher, all the way to the all-time highs.
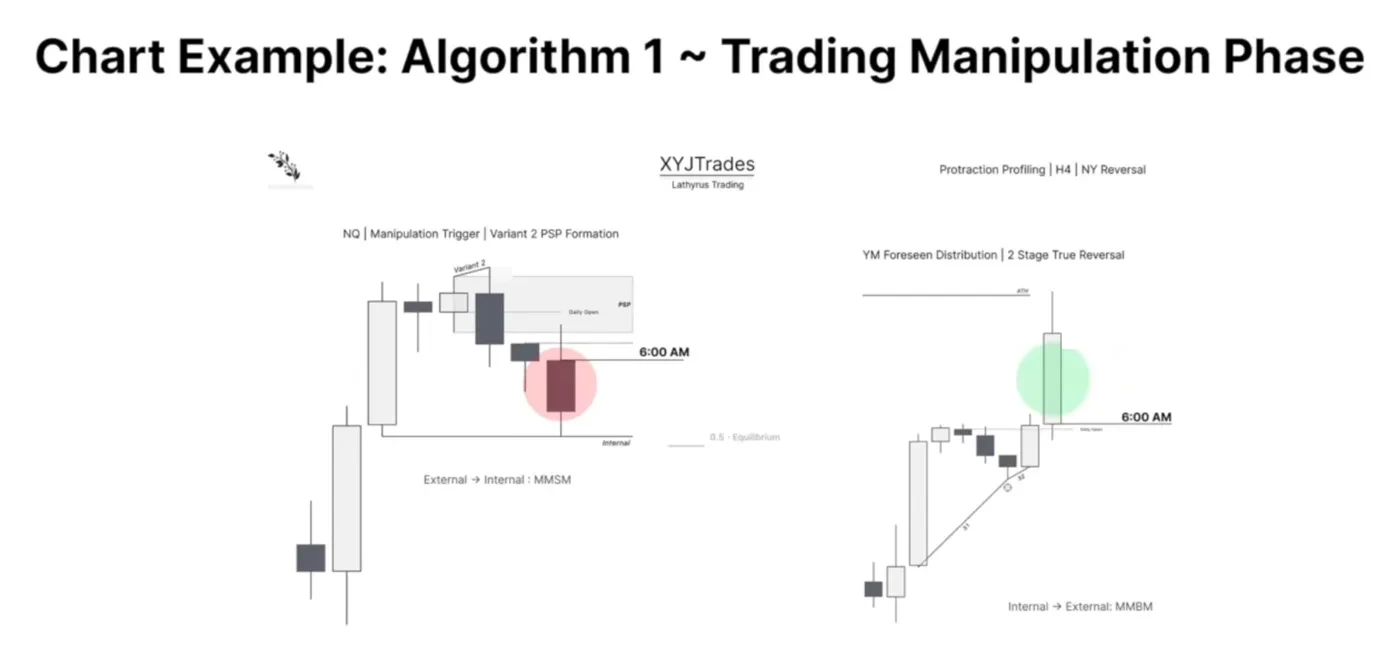
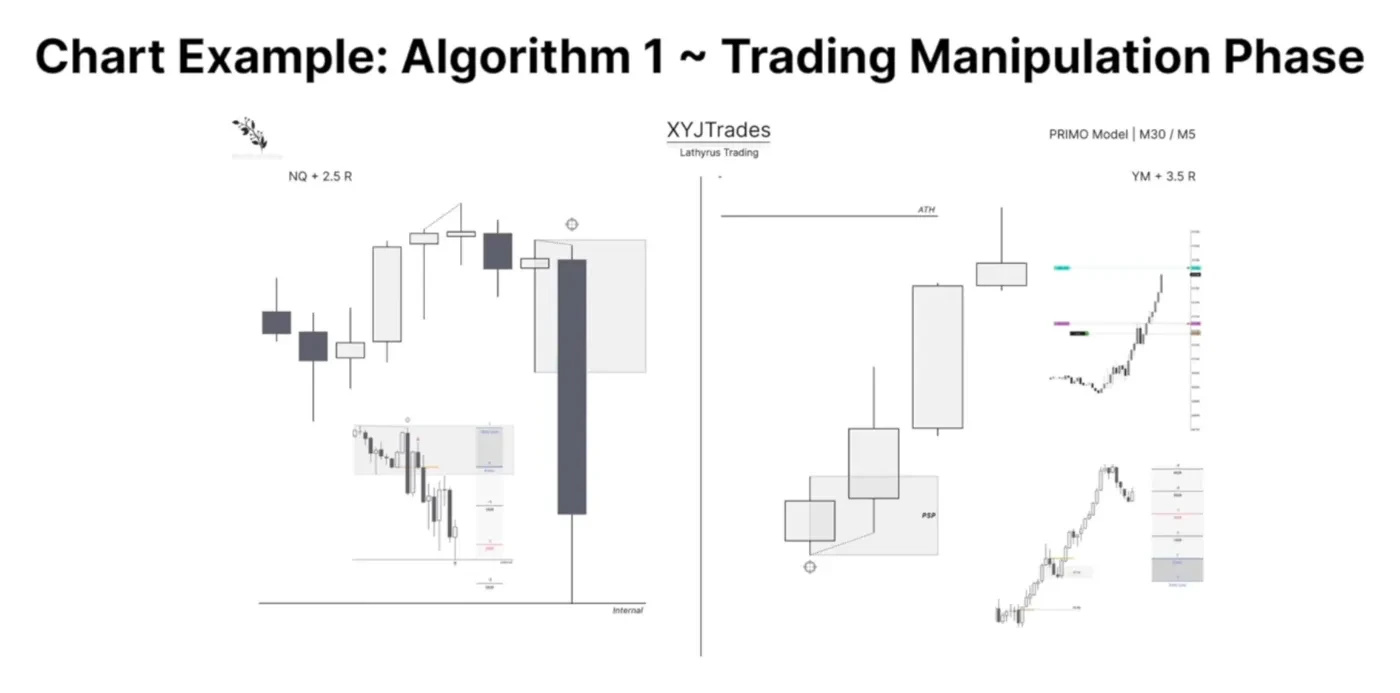
It comes from an understanding of what price is really doing in opposing deliveries. When we have opposing deliveries, we are either failing to manipulate a level and then resyncing, or we are reversing from a level. What I always suggest is to trade the resync: wait for the trigger and trade the confirmation of the resynchronization. The same applies in Algorithm 2: instead of trading the middle asset break, wait for the resynchronization and trade the expansion lower all in sync. Then, as you get more exposure to these types of trades, you can start to trade the manipulation as well.
Chart Examples Of Type 2
Algorithm 1, example one. Out-of-sync markets on the daily chart. The Dow Jones expands to its range high, the S&P is near its OTE, and NASDAQ forms a bearish down-close candle after forming an SMT fill. Out of sync, out of phase. On the lower time frame that day, a 6 a.m. expansion forms the high on NASDAQ and YM with a PSP. YM forms a bullish up-close 6 a.m. candle, as in Algorithm 1, and the 6 a.m. candle closes with ES and NASDAQ in foreseen distribution. So in this case it is not YM trading lower, it is ES and NASDAQ trading in the true direction of the daily candle, toward the internal.
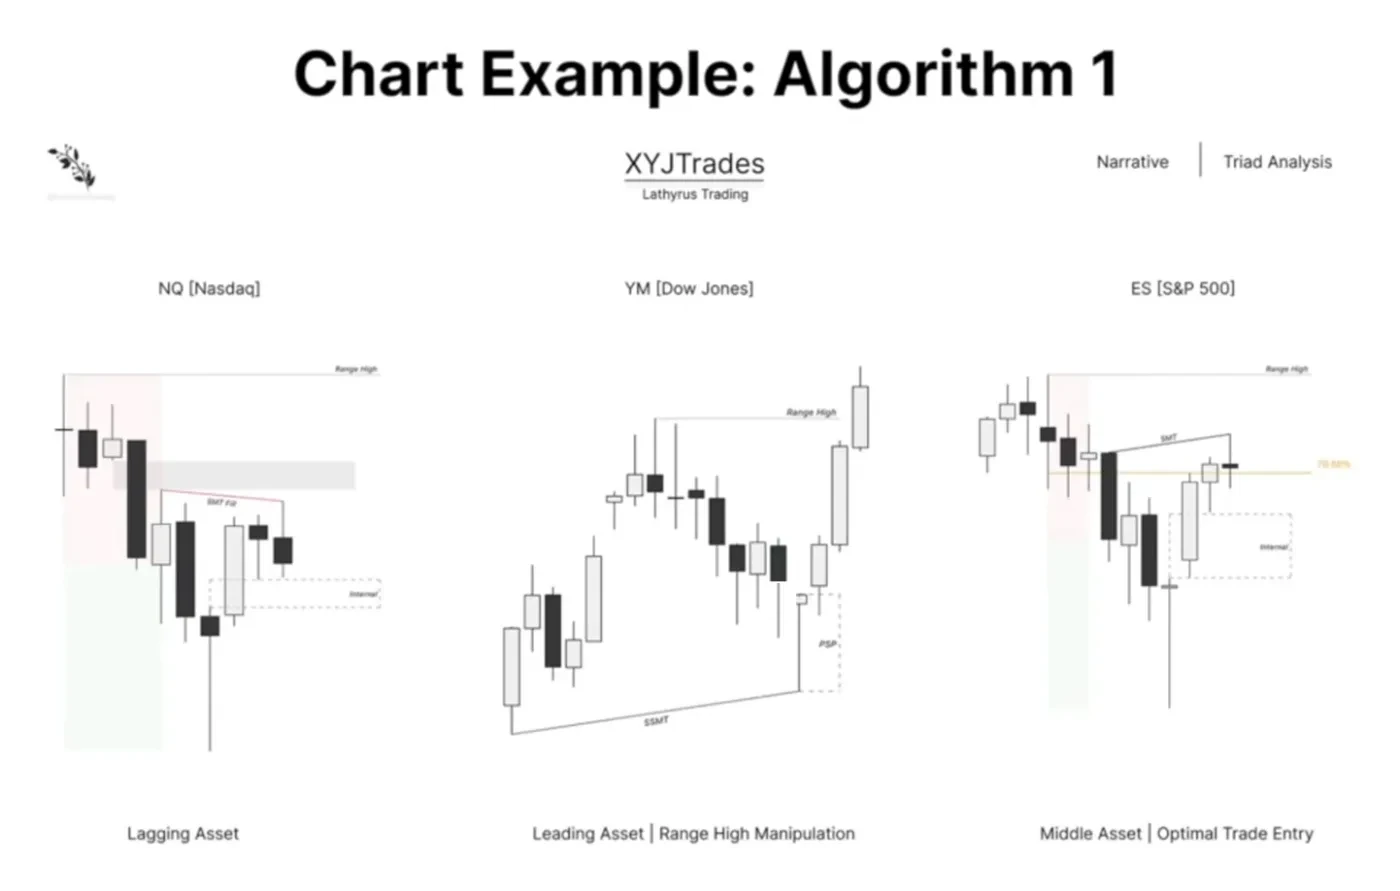
At 10 a.m. NASDAQ fails to manipulate the low, the same low that ES failed to manipulate, and we have a lower draw on liquidity. So we can trade ES as the middle asset once we see YM reverse. YM, as it expands higher, forms a 2-stage PSP on the 4 hour: 10 a.m. and 6 a.m. diverge. Then we get an SMT fill signature on ES, with the candle higher in the range, close to the internal draw, because NASDAQ already took it and failed to manipulate it. It forms a Strength Switch PSP, the down-close candle against the up-close candle, and SMT confirms the PSP, the variant I taught you. Once the SMT fill confirms the PSP, we take an entry on the 1 minute and hold all the way to the SMT break level. Meanwhile YM is reversing from the high of its range back internal, so everything realigns: YM and ES Strength Switch and become weaker, while NASDAQ, which came into the lows, consolidates while the other assets play catch-up.
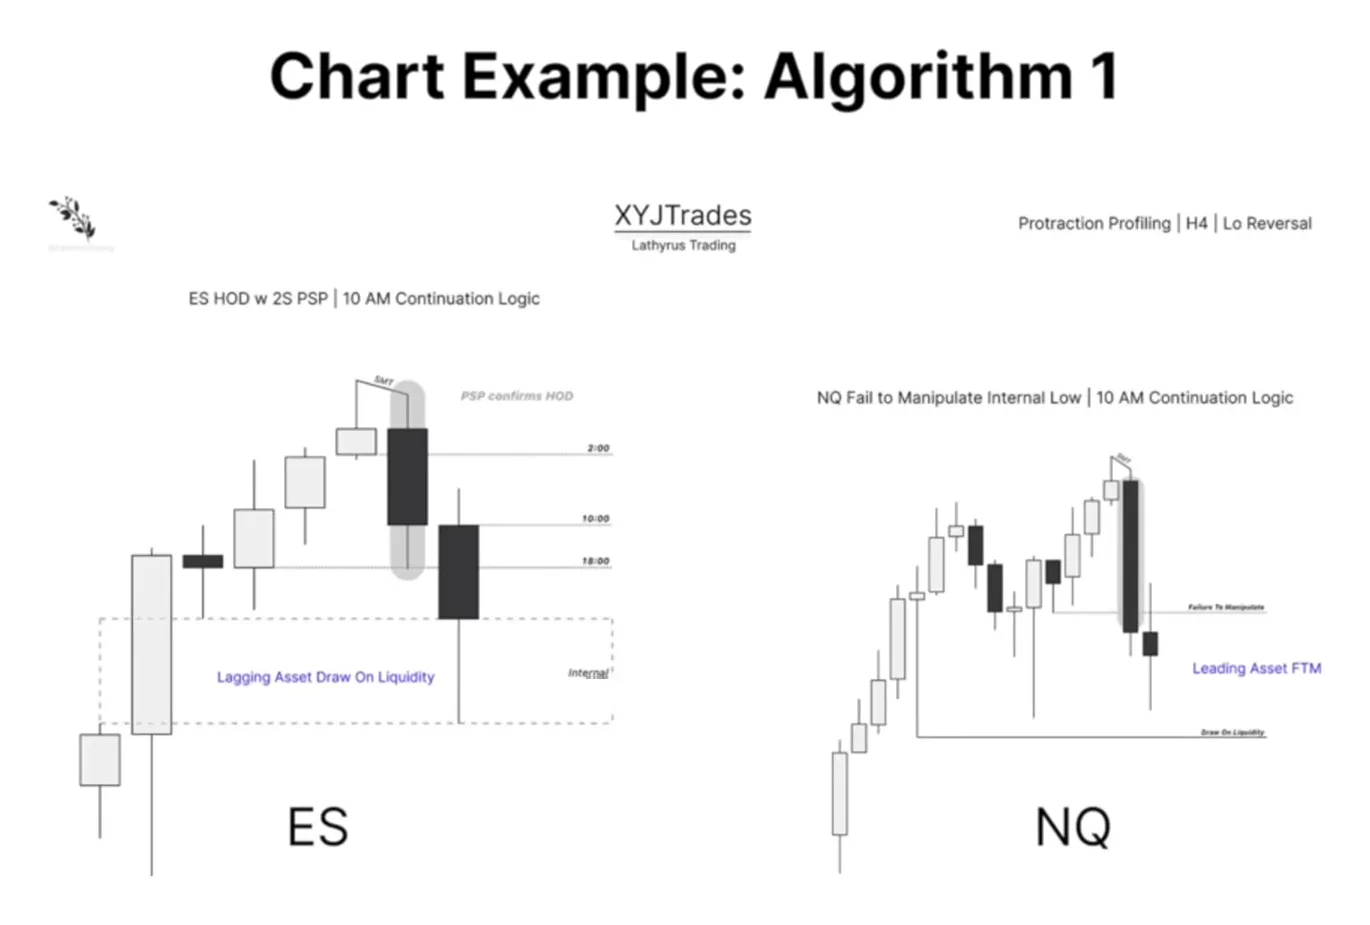
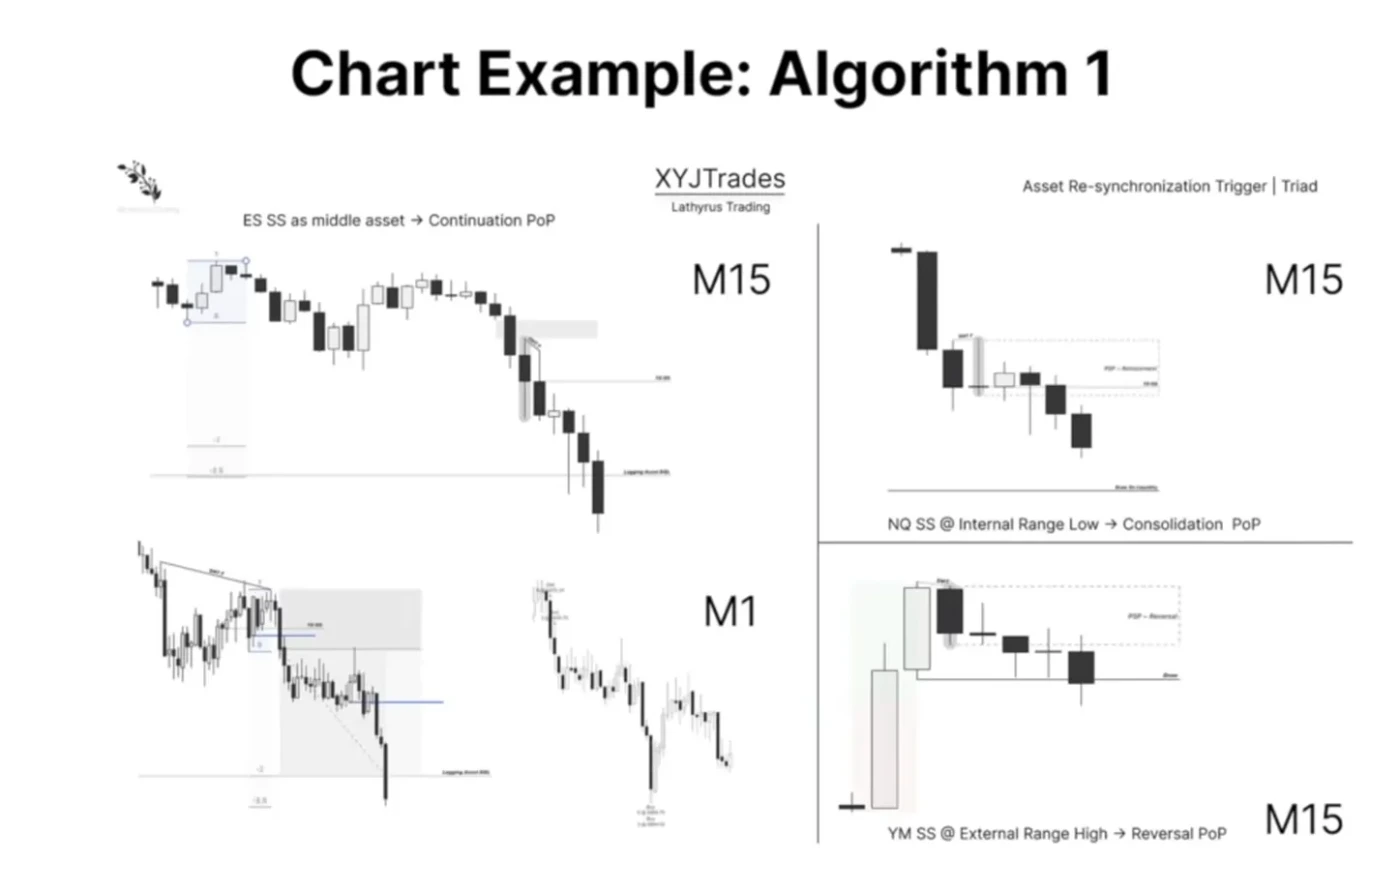
Algorithm 1, example two. At 6 a.m. YM creates a 2-stage PSP. The universal model is external to external: 4 hour high, 4 hour low, an order paired range, with failure swings. YM and NASDAQ form the 2-stage PSP at 6 a.m. Then 10 a.m. opens and NASDAQ is failing to manipulate the range high. So YM can play catch-up while NASDAQ continues to expand: YM, as the lagging asset, can break the SMT. I have my 2-stage PSP, PSP confirms SMT, so I can trade this candle as a C3. We wait for it to close and then trade C3. We do not need to see the low swept; that low can be a protected low as long as we get a Strength Switch.
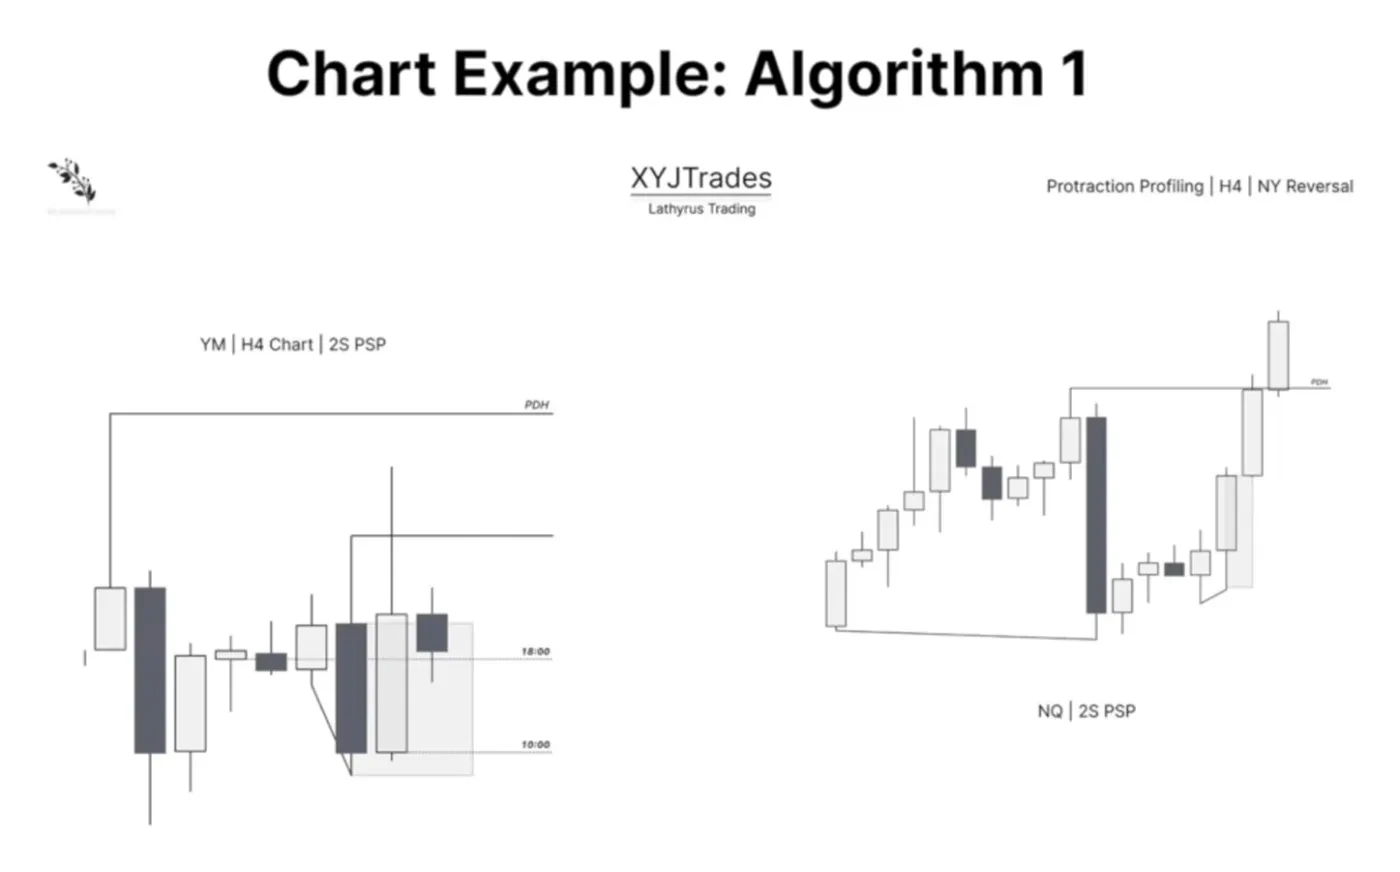
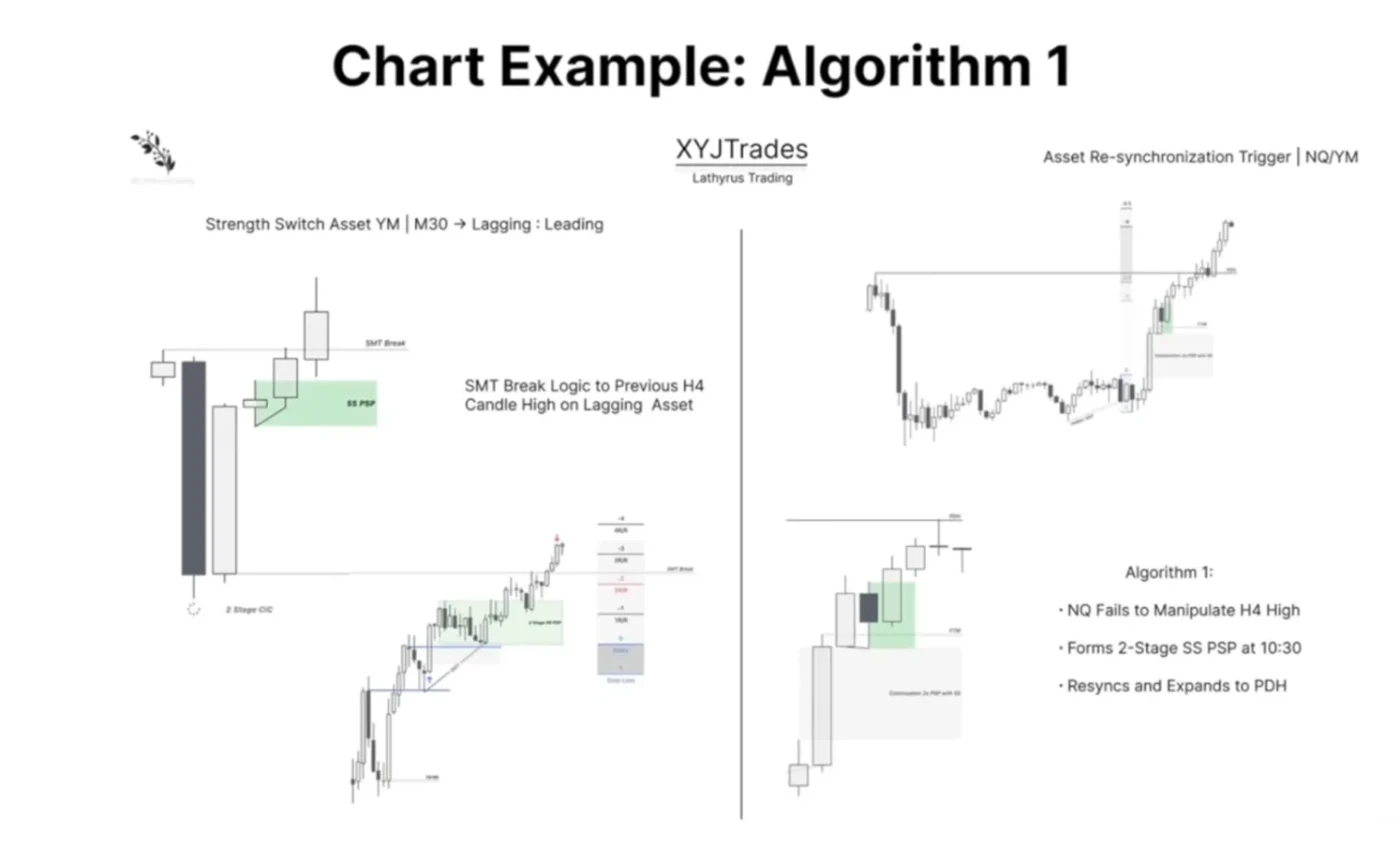
On the 30 minute, the low at 9:30 before 10 a.m. opens is a PSP with NASDAQ forming SMT. Then 10 a.m. opens with the SMT break level up above, and I am waiting to get involved, but there is no opportunity at 10, it just opens and immediately trades higher, and NASDAQ does the same. Then I need to see a form of Strength Switching. We create a PSP, a candle higher in the range forming a down-close accumulation while the other asset expands: one consolidates, one retraces. Then we form a 2-stage PSP, NASDAQ sweeps the low and YM does not, and I take an entry as soon as that closes, at the change in state of delivery, and hold for the SMT break. So the algorithm: NQ failed to manipulate the 4 hour high, this imbalance failed to reverse, it forms a 2-stage Strength Switch PSP, and then we resync and expand together, one consolidating while the other expands, breaking the SMT.
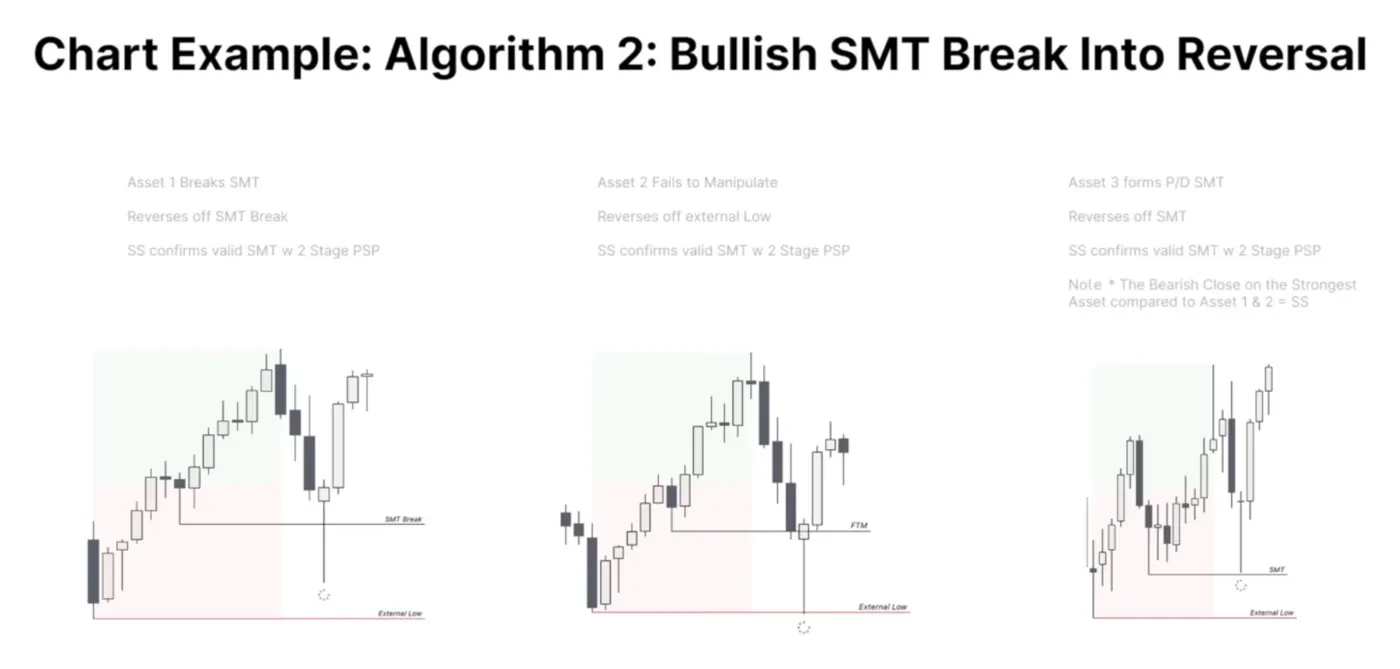
Algorithm 2, a bullish SMT break into reversal. First we draw out the premium and discount range for all three assets, the low and the external low. Step one, the leading asset, asset two, fails to manipulate the low. As it does, asset one is in very close proximity to that low, far from the external low but still very close to this one, so we can frame an SMT break of that specific low. You can go to the lower time frames to see the SMT break, which will be some sort of swing formation, and then we trade higher. I am not showing the lower time frame swing formation here, just the logic of the algorithm; go into your own charts and find examples.
We get the failure to manipulate and then the candle breaking the SMT. Asset one trades into the range low and we form a PSP, so we are reversing off the SMT break on one asset and off the external low on the other. Look at the Candle 2 closure: a Strength Switch observed by this PSP. The asset that trades into the external low closes as a bullish reversal candle, the asset that breaks the SMT closes as a bullish reversal candle, and the asset that forms SMT at both lows, asset three, forms the premium and discount, deep range SMT.
You might think, why is that SMT not going to break, if an SMT near its low is supposed to break? Because of the Strength Switch. The Strength Switch confirms the SMT: a bearish closure while the others are bullish closures. Then all assets expand to the external high, and the asset in closest proximity to the high, the leading asset higher, should break it first. We trust that low will hold because we see a middle asset SMT break. Asset one trades into the low and fails to reverse, the middle asset breaks the SMT, ERL to ERL universal models, and all assets expand together with a 2-stage crack in correlation, PSP confirming the SMT. This is how you trust SMTs to form: when you get the bullish SMT break of the middle asset, you can trust the asset that did not take the lows to hold its SMT, despite its proximity, based on the Strength Switching in this algorithm.
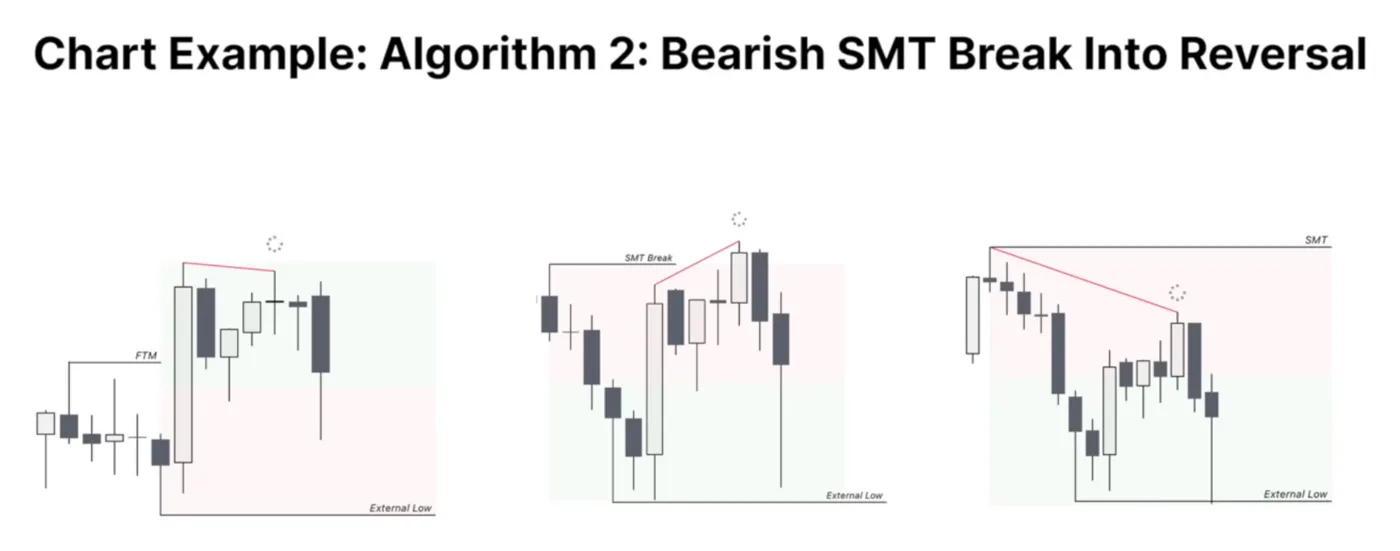
Algorithm 2, a bearish example on the weekly chart. We come into the high on asset one and fail to manipulate, putting in a consolidation. Spoiler: if you find this exact example in your charts, you will see that once we form that low, as in the previous example, we end up taking out the high, and we trust that the SMT holds on the same logic on the lower time frames. We have an SMT break of the high: we fail to manipulate the same daily high, we start to consolidate, the middle asset breaks the SMT and we get a Strength Switch PSP. A 2-stage SMT with the SMT break, where the asset that trades highest forms SMT, one asset forms a bearish down-close candle, the other a bullish up-close candle, a Strength Switching PSP. That candle already took the high and already manipulated, so it does not need to trade any higher. Then we see a synchronized reversal sequence. The same sequence: fail to manipulate, new phase of price, SMT break of the middle asset, synchronized reversal. This is a large range SMT and it should hit the range low first.
Key level, fail to manipulate, SMT break, 2-stage crack in correlation and Strength Switch. The Strength Switch PSP is there, and then the external low is taken, internal to external, just as we traded internal to external in the bullish case.
That's the end of this lecture, I hope you found value reading this and you learned something new that you can apply, or further refined your knowledge on this subject.
Back to the top