Introduction
Most traders do not fail in their ability to identify a draw on liquidity or to execute a lower time frame entry technique. What they fail to do is build a price narrative.
In this lecture I teach you exactly how to bridge that gap through protraction profiling. You will have a far better ability to predict, and involve yourself in, the crucial market expansions, plus a set of repeatable, mechanical and actionable frameworks you can use in your trading every day.
Building A Price Narrative With Protraction Profiling
Core Logic
In this chapter you learn how to define the two stages of a candle, the manipulation or protraction phase and the expansion or distribution phase, and how wick size and the profile are related.
First, the higher time frame candle associated with this logic is fractal. In this lecture we focus on daily protraction profiles, but you will also use candles on other time frames, with the same logic, to profile sessions and intraday candles.
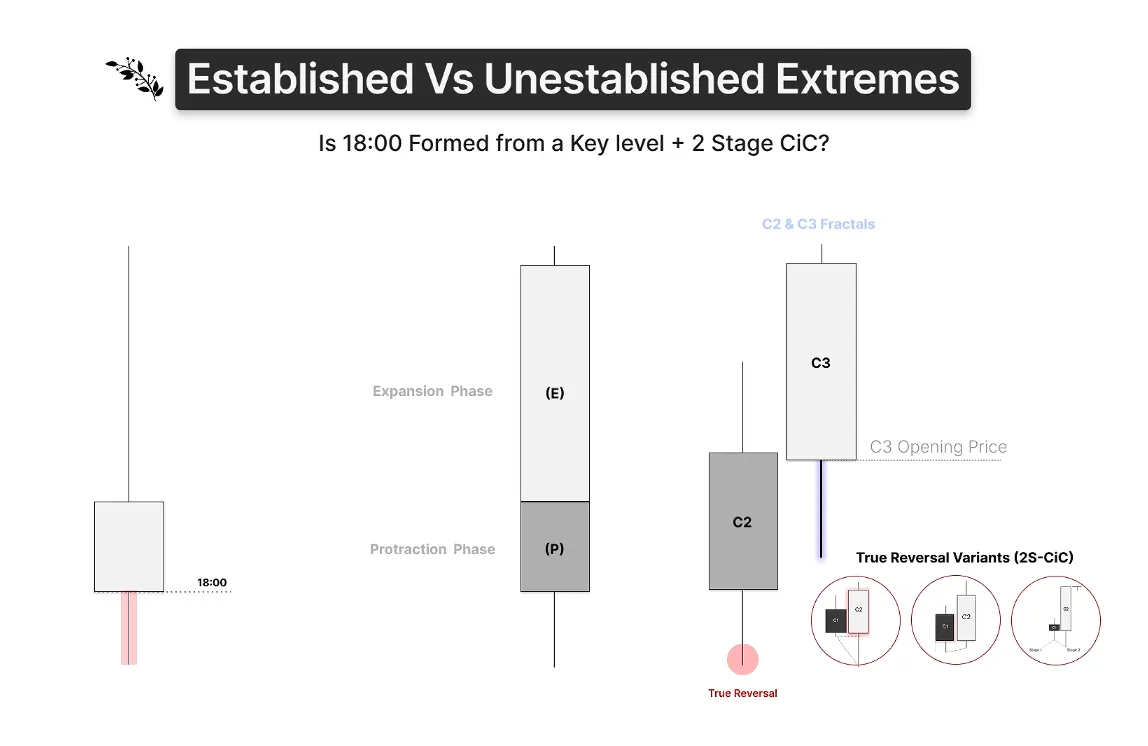
The protraction phase, or manipulation phase, of a candle is its deviation beyond its open. For a bullish candle, the protraction phase is the move from the open down to the low, creating the daily wick, before the candle expands from its low to its high.
The expansion phase comes once the wick has been created: the body of the candle, from the low to the high and eventually off the high to the close. For the bearish case the same is true, with open to high being the protraction phase and high to close the expansion phase.
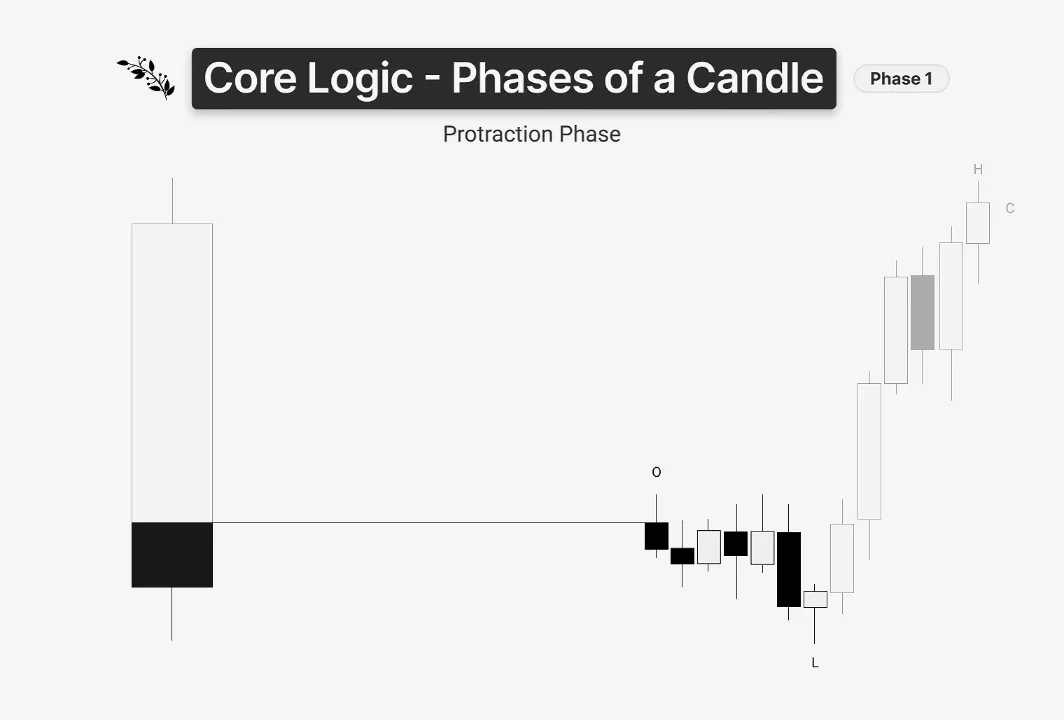
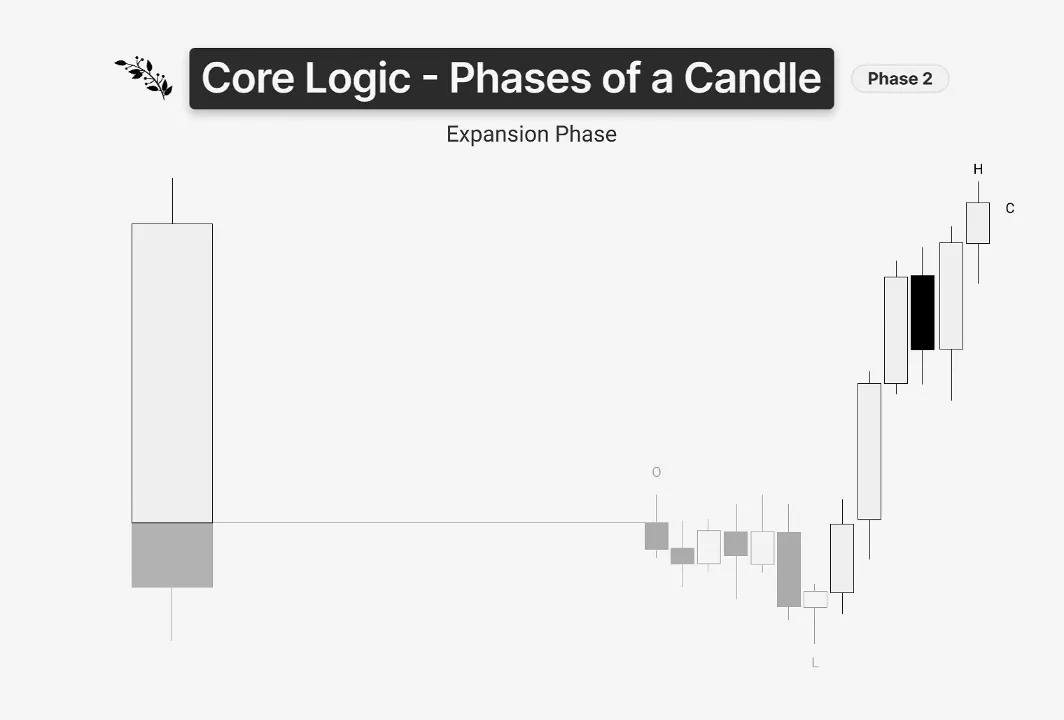
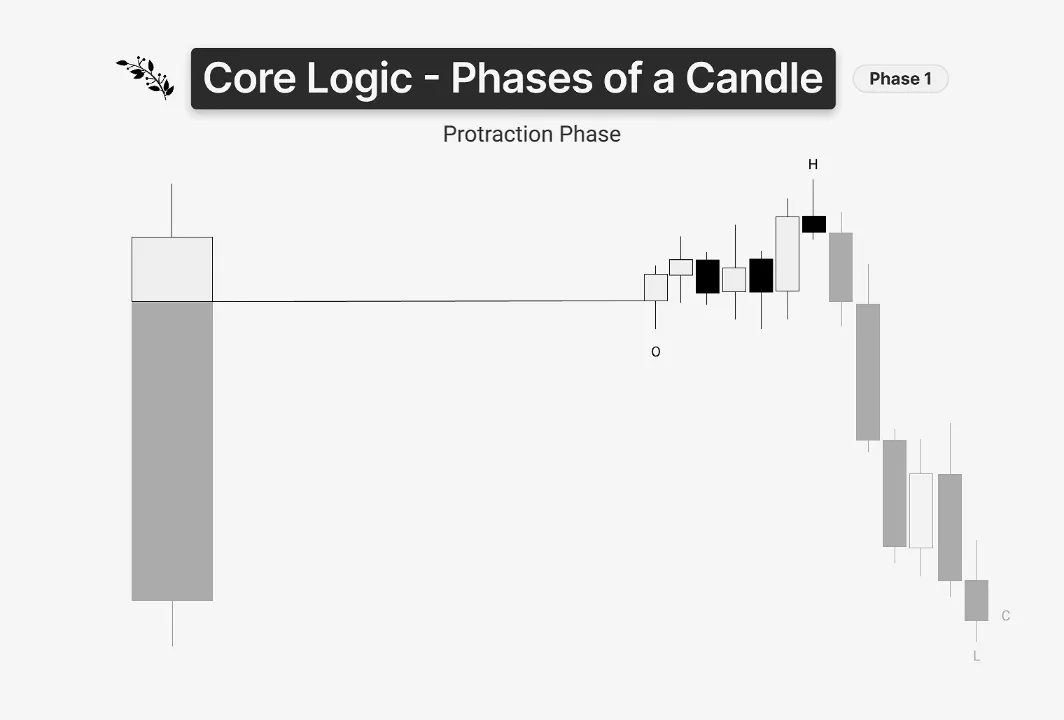
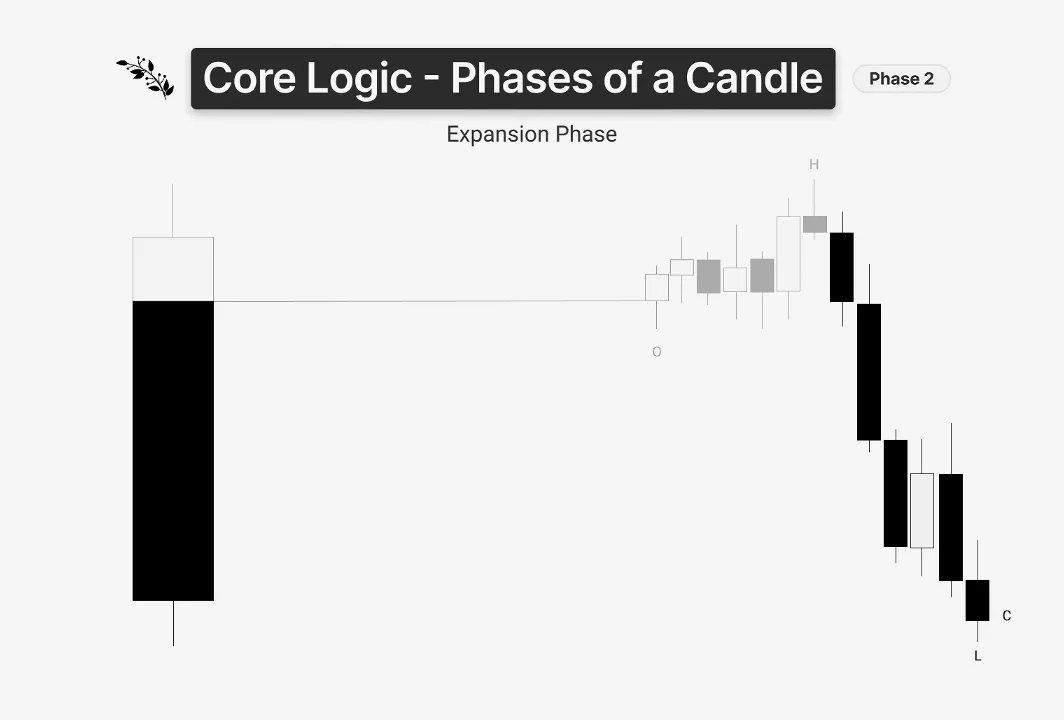
Our investigation of protraction profiles is really about understanding where the highs and lows of days are made, and what conclusions we can draw about session dynamics from them. Before that, we need to understand wick size and profile alignment.
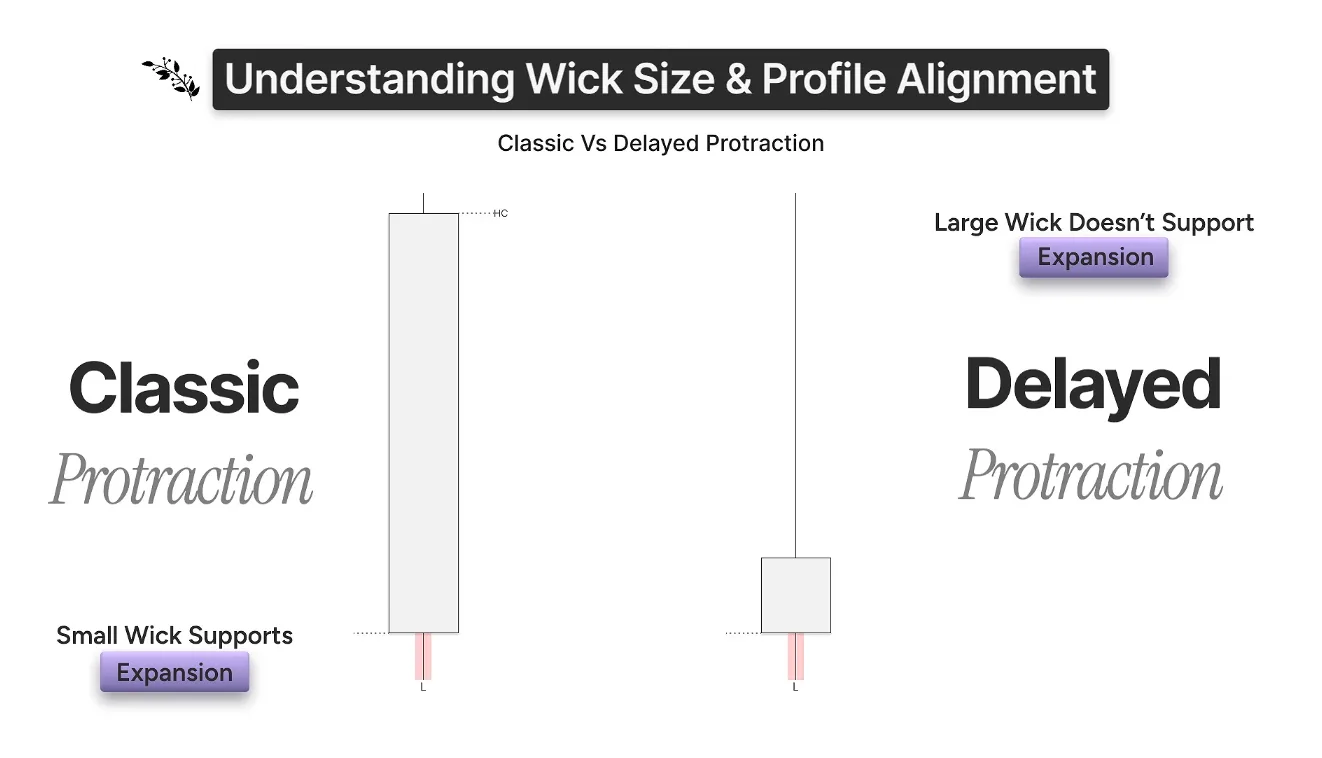
The key conclusion is that a small wick supports a large body: there is an inverse relationship between wick size and body size. A small wick candle that prints a large expansion in its body is what we call classic protraction.
Where a bullish candle opens with a large opposing run, we say that large wick candle does not support expansion, and we call it a delayed protraction profile. This is very important, because expansion through the open is a negative condition for this type of profile, so the 18:00 daily open becomes a key level in our analysis for every delayed protraction profile. We go into this in much more depth in the Delayed Protraction And Large Wick Session Profiles chapter.
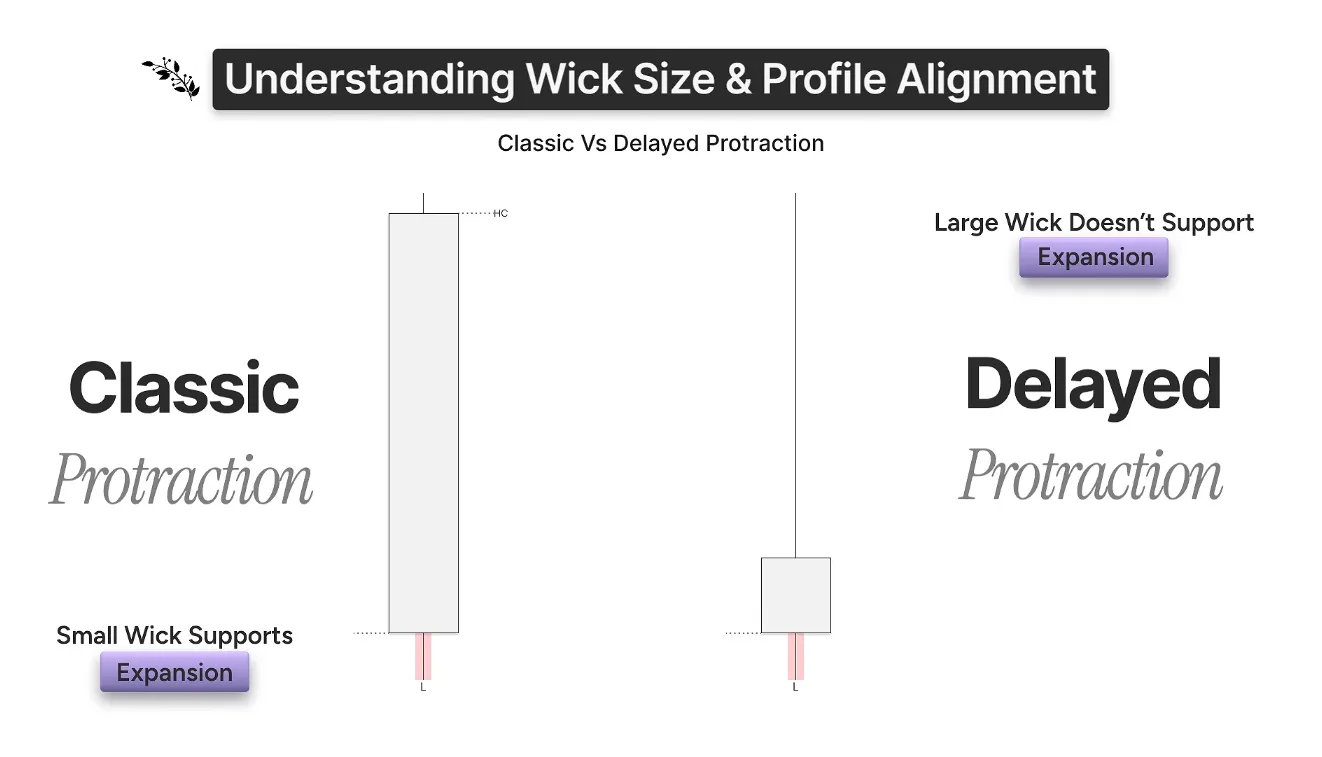
So, to wrap up the core logic: a candle has multiple phases, the protraction phase and the expansion phase, and there is an inverse relationship between wick size and body size.
The chart examples were all live-conducted examples, so please refer to 3:51 in the YouTube video accessible on the right-hand side of this page.
Fractalizing Price And Understanding How Swings Form
In this chapter you learn how to fractalize price: not only the protraction and expansion phases of a candle, but how they relate to swing formations. We use various time frames to understand where the lows and highs are made, and how to trade away from them.
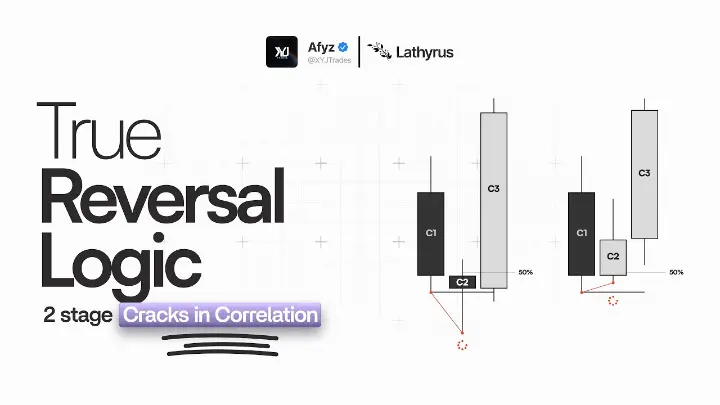
Let's define the daily candle through a Market Maker Model. You might recognize the schematic from my masterclass series; here we focus on the Candle 2 and Candle 3 logic of an expansion candle. Superimpose the classic protraction bullish candle on the left and you can see that part of the candle is made by a reversal candle from a key level, and part of it, the expansion phase, by a continuation candle, a C3. As a Market Maker Model, these are the classic reversal and redistribution areas, eventually targeting the opposite side of the range.
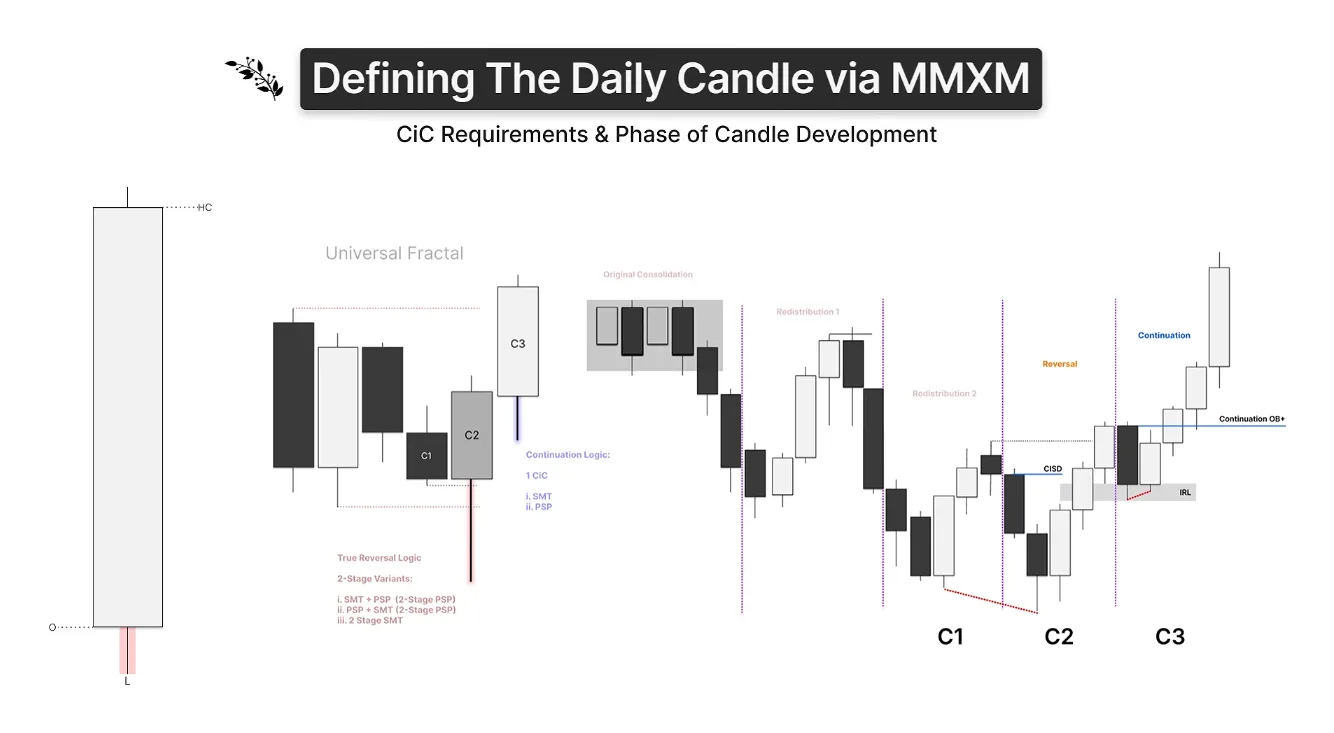
This is very important, because it introduces swing point logic into protraction profiling, and it defines the conditions for the reversal and for the continuation. As you know from my masterclass series, we need a 2-stage reversal to frame a swing point, which can be fractalized down to a lower time frame swing point, and a one-stage crack in correlation to frame continuations.
So in terms of the schematic: we have a C2 formed with some sort of 2-stage crack in correlation, an SMT plus a PSP, or a 2-stage PSP or SMT variant. Then we have continuation within a continuation candle on the fractal, the 4 hour for daily profiles, formed from a gap or some sort of internal range liquidity like an order paired range.
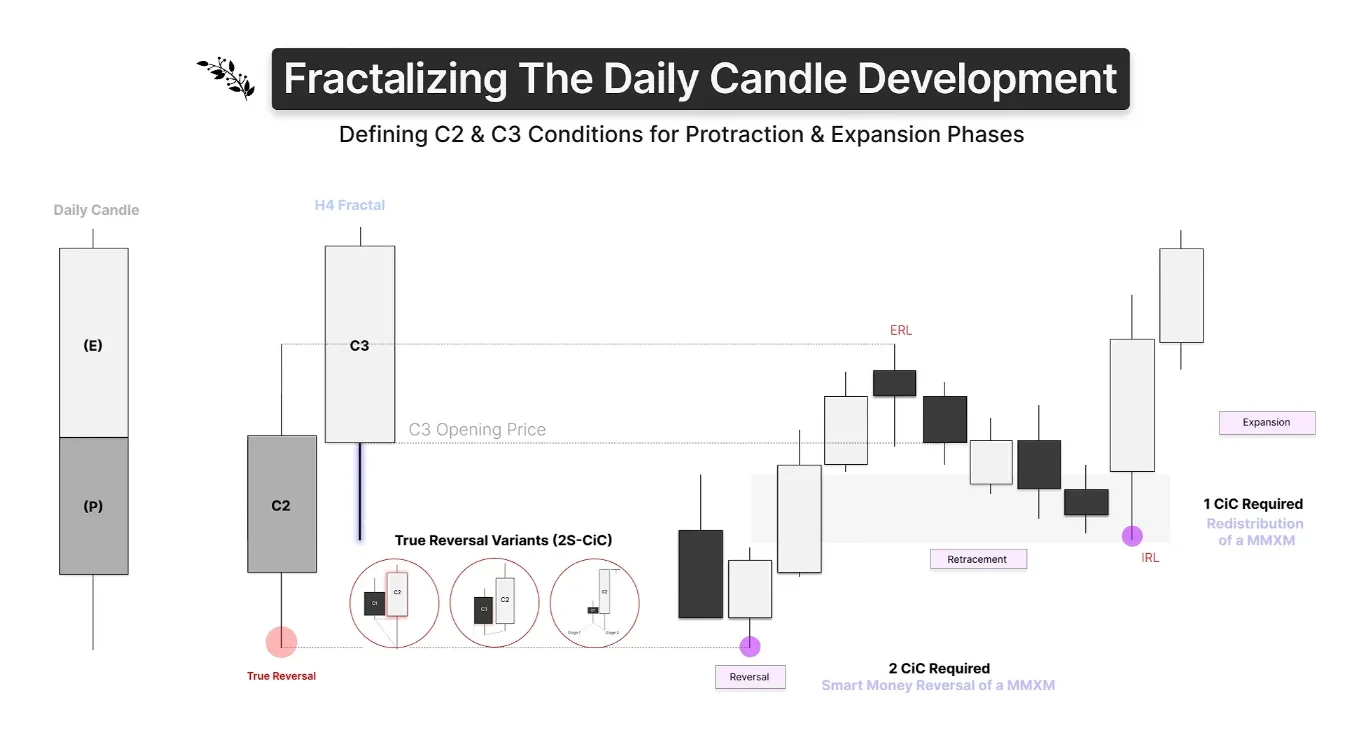
One step further: here is the classic expansion candle, or protraction candle, with its two phases, and the C2 and C3 definition on the 4-hour fractal showing where the low is made, the manipulation in the reversal candle C2, and where the body, the expansion, is made, the C3 continuation. For true reversals on this 4-hour fractal we want a 2-stage crack in correlation; this is the smart money reversal of our MMXM, covered in my first lecture on timing expansions. Once we get expansion away from that low, we can trade continuation in Candle 3, perhaps a 4-hour candle within the daily candle's range, from a gap or an order paired range, where we require a one-stage crack in correlation. That is part two of my masterclass, so if you have any difficulty combining protraction profiles with expansion models, reversals and continuations, go back to parts one and two.
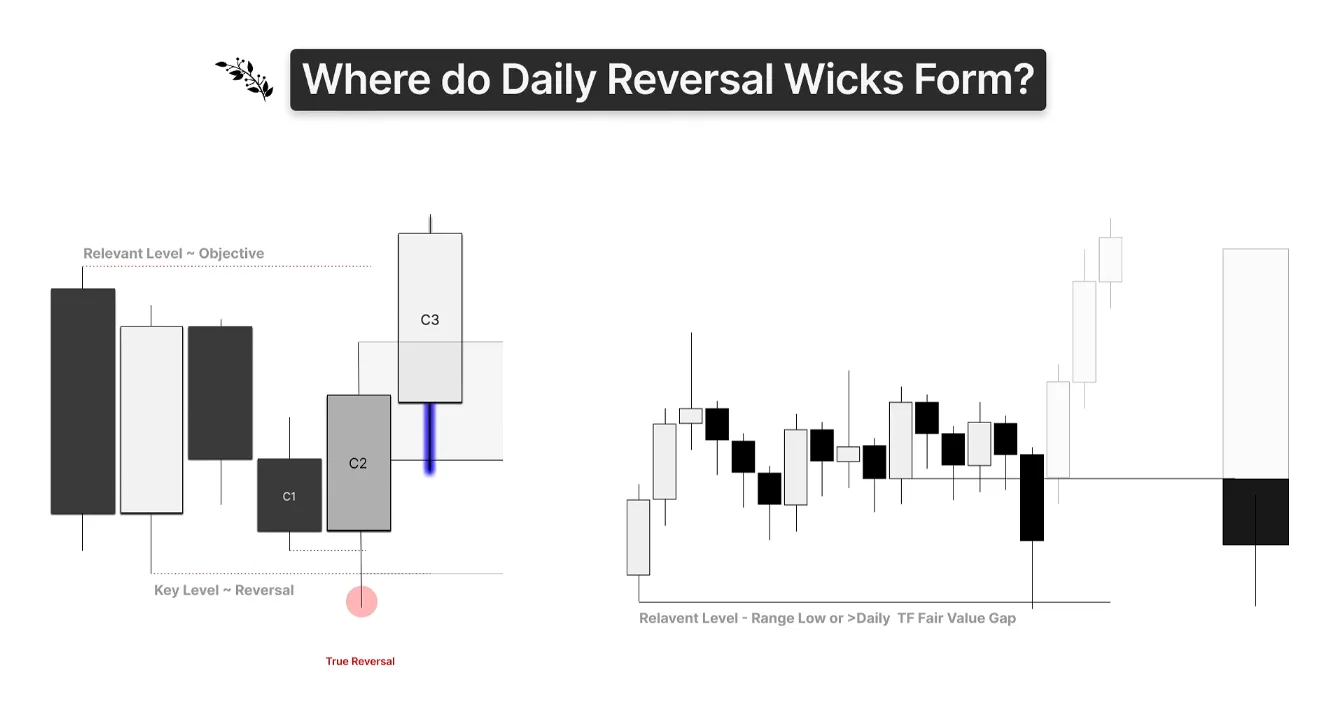
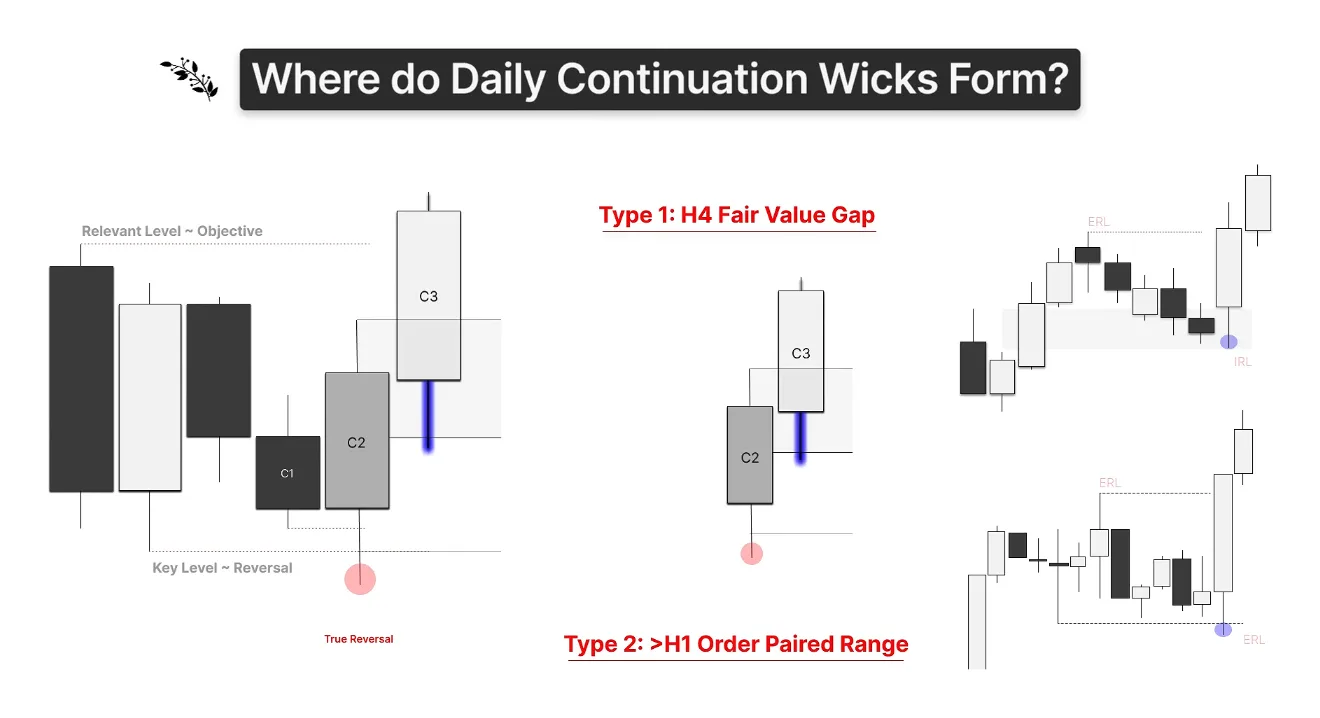
Where do daily reversal wicks form? Take the universal fractal on a daily chart with the C2 reversal candle. If it is going to be a true reversal, it forms from a range low, as in this ERL to ERL example, with a wick that closes back inside the range for the body before we expand higher. So the relevant level for a daily reversal candle is either a range low or a daily or weekly fair value gap, the IRL to ERL variant of the universal model, as we have seen in previous lectures.
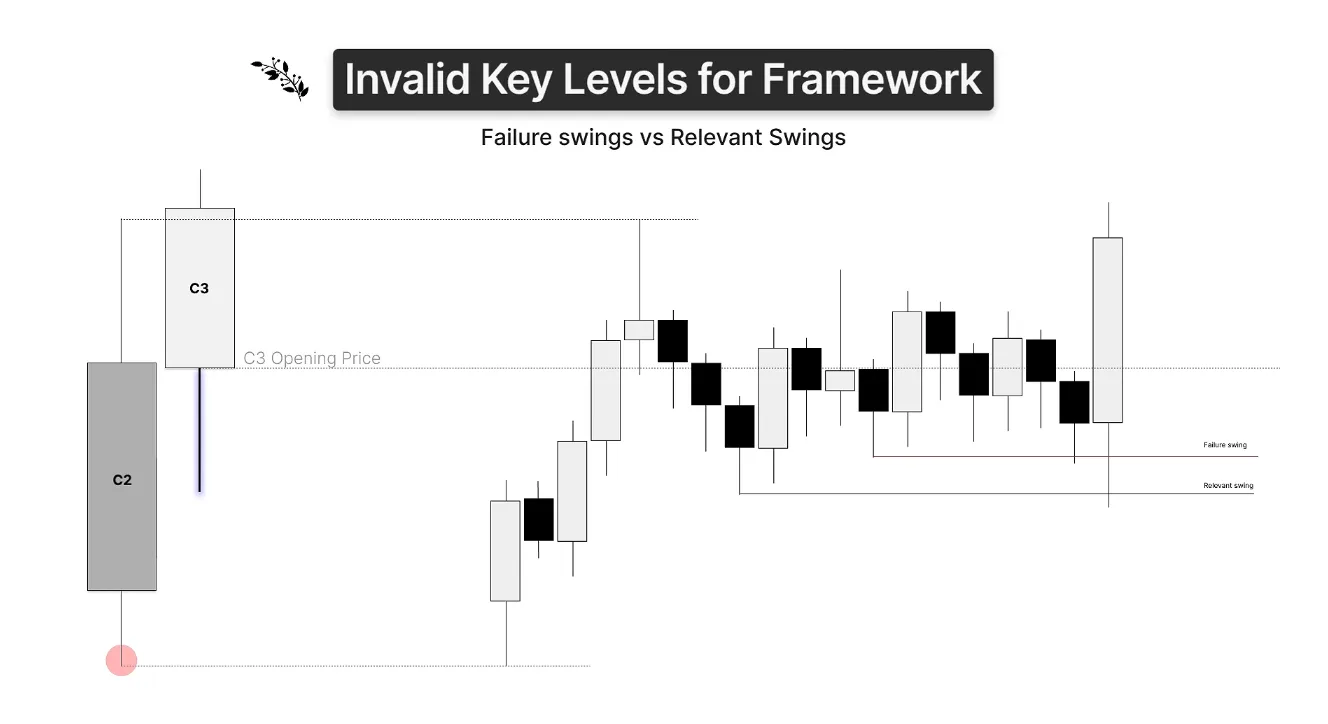
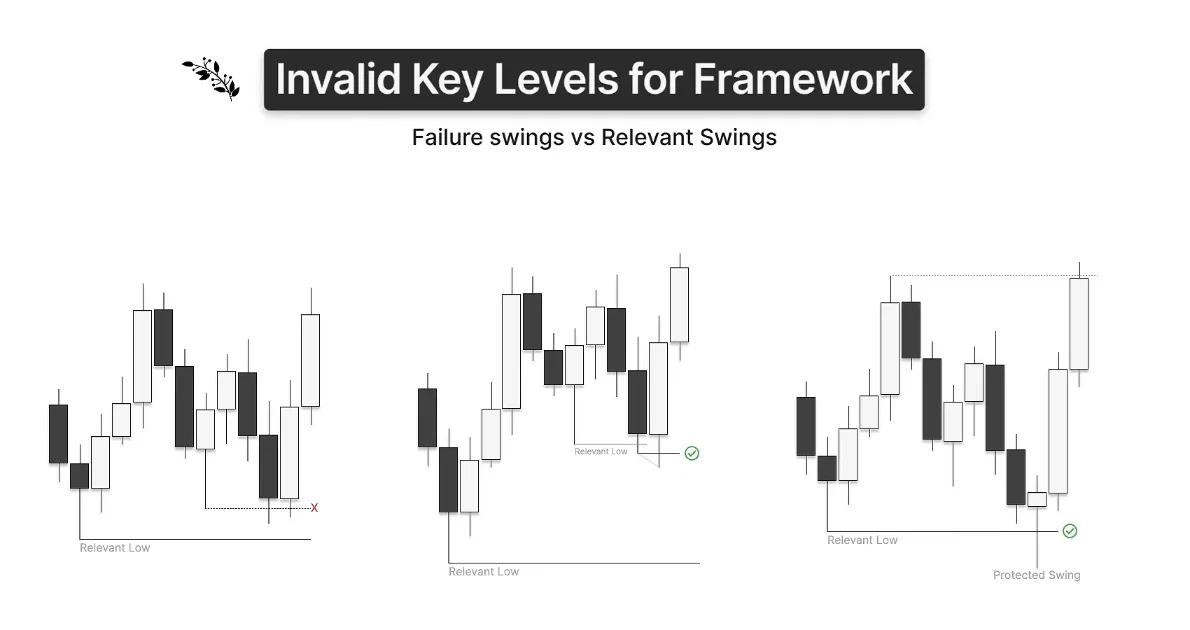
What are invalid key levels? Here a continuation candle, C3, prints a small wick into the upper half of the opposing candle's range. But we do not want to trade a wick, a protraction phase, as a true manipulation when it forms from failure swings. We always want relevant swings. How do we know the wick has truly formed the protraction phase and is set to expand? We use proximity: we want sufficient spacing between swing points to define them as relevant. Without that spacing, as on the left, the low is not relevant enough to form the protraction phase of the daily candle. We want it like the middle or right-hand cases, a protected swing formed from a relevant sweep based on proximity.
To recap: we are looking at daily candles, open-low-high-close and open-high-low-close, as a function of their 4-hour fractals, C2 and C3. Daily wicks in continuation form from either an order paired range, on a time frame greater than the 1 hour, where the previous day's Candle 2 expands and then consolidates and the next day's protraction phase sweeps an order paired low before expanding, or, in the typical variant, a continuation inside a 4-hour gap in the previous day's range. Understand these two types of continuation wicks and you have a complete framework to profile where the low of these daily C3 candles will form, and you already have a profile for where the low of the daily C2 candles is made.
The chart examples were all live-conducted examples, so please refer to 15:28 in the YouTube video accessible on the right-hand side of this page.
Classic Protraction And Small Wick Session Profiles
Now we blend the first two components: the protraction profile with the 4-hour key levels where highs and lows are made, and we introduce the sessions, Asia, London and New York.
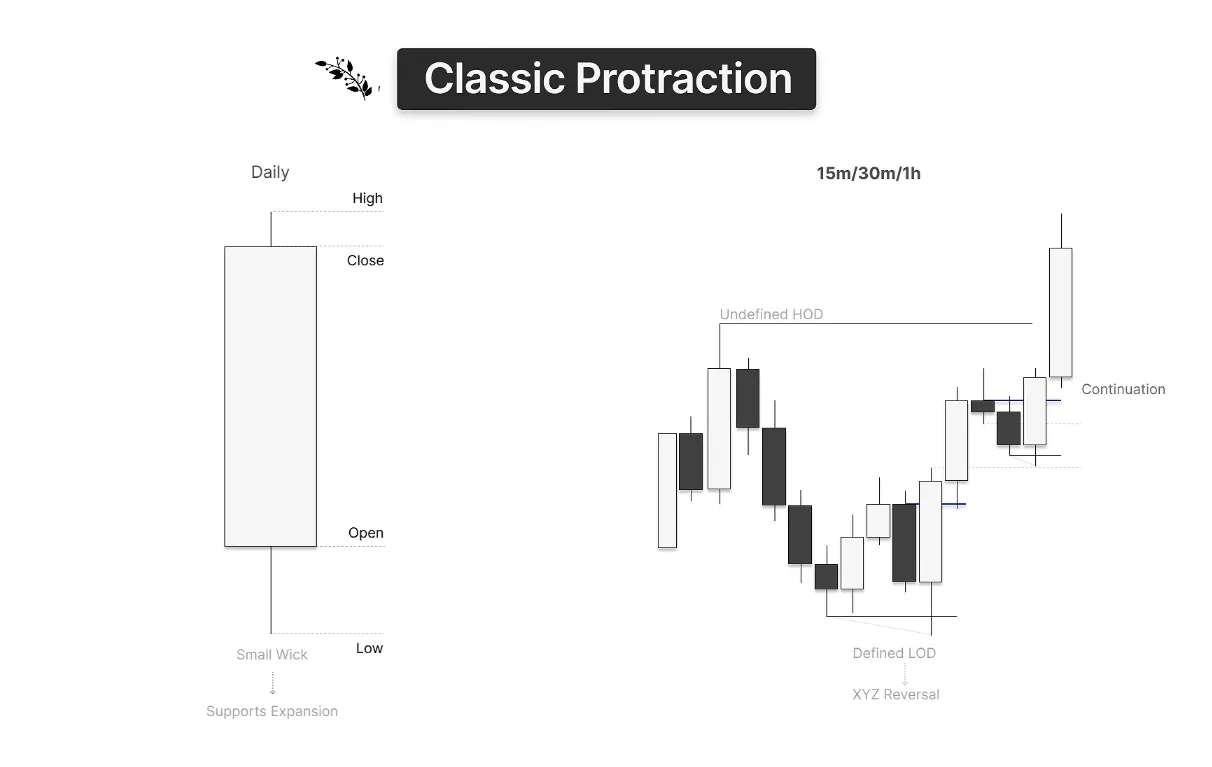
First, a recap. A classic protraction candle is a small wick manipulation phase with a large body. Its fractal looks like trading away from a defined swing point toward the other side of the range, forming the expansion candle; you can see what the 15 minute, 30 minute or 1 hour might look like here. Now we blend this logic with the timing of reversals to understand session dynamics: which session is reversing and how we can trade it, and which sessions are continuations away from those reversals.
Profile A1: Asia reversals. These are overnight reversals, where the protraction phase of the daily candle, the low of the day in a bullish candle, is created in the 4-hour 22:00 candle. It can also be created in the 4-hour 18:00 candle as a C2 closure. In the lower time frame Market Maker Model, Asia reverses, London may consolidate or expand, and New York continues the trend.
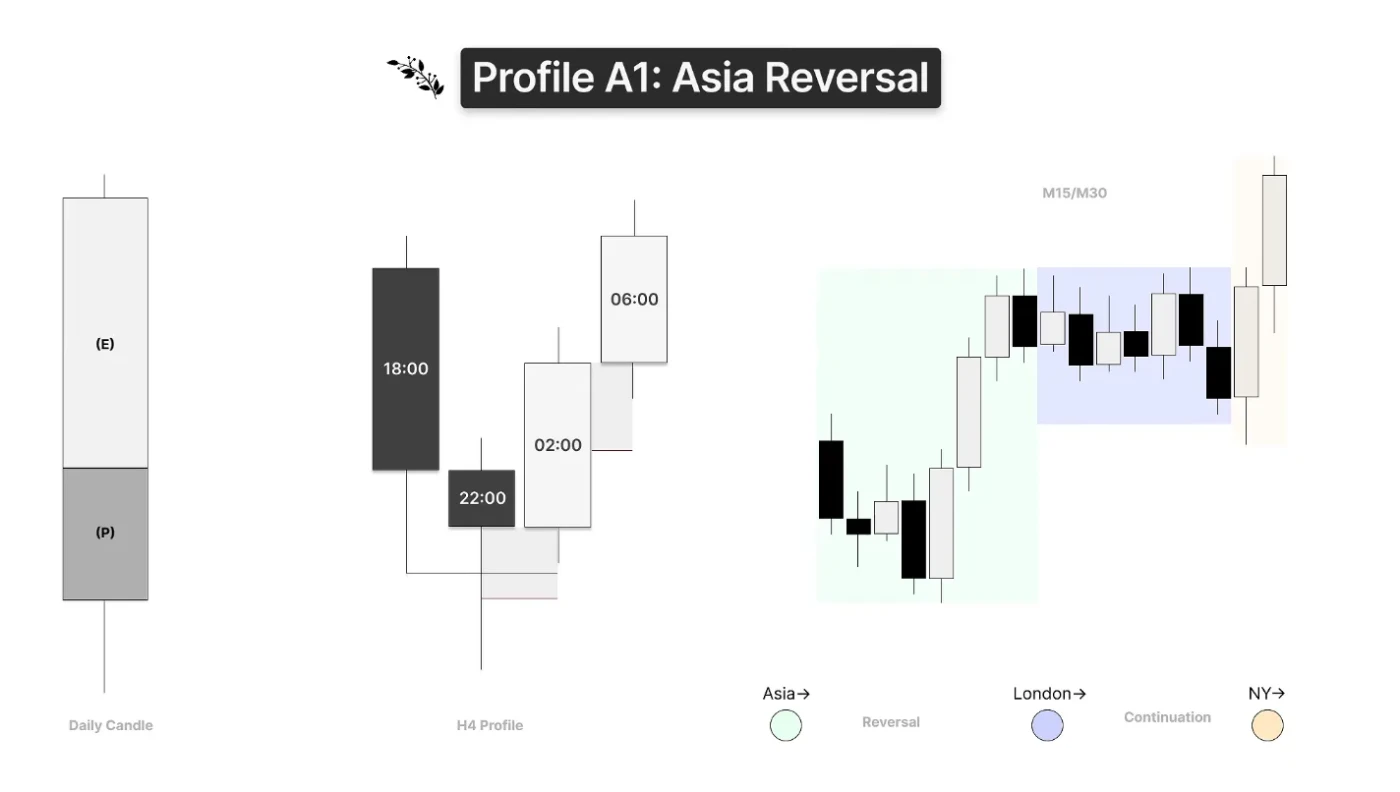
With the 4-hour profile from the Fractalizing Price And Understanding How Swings Form chapter, in the bearish case the high of day might form from a range high with a 2-stage crack in correlation between one asset and a correlated asset, for example NASDAQ and YM, or gold and silver, inside the 18:00 or 22:00 candle. Either one on the 4 hour can be your Asia reversal.
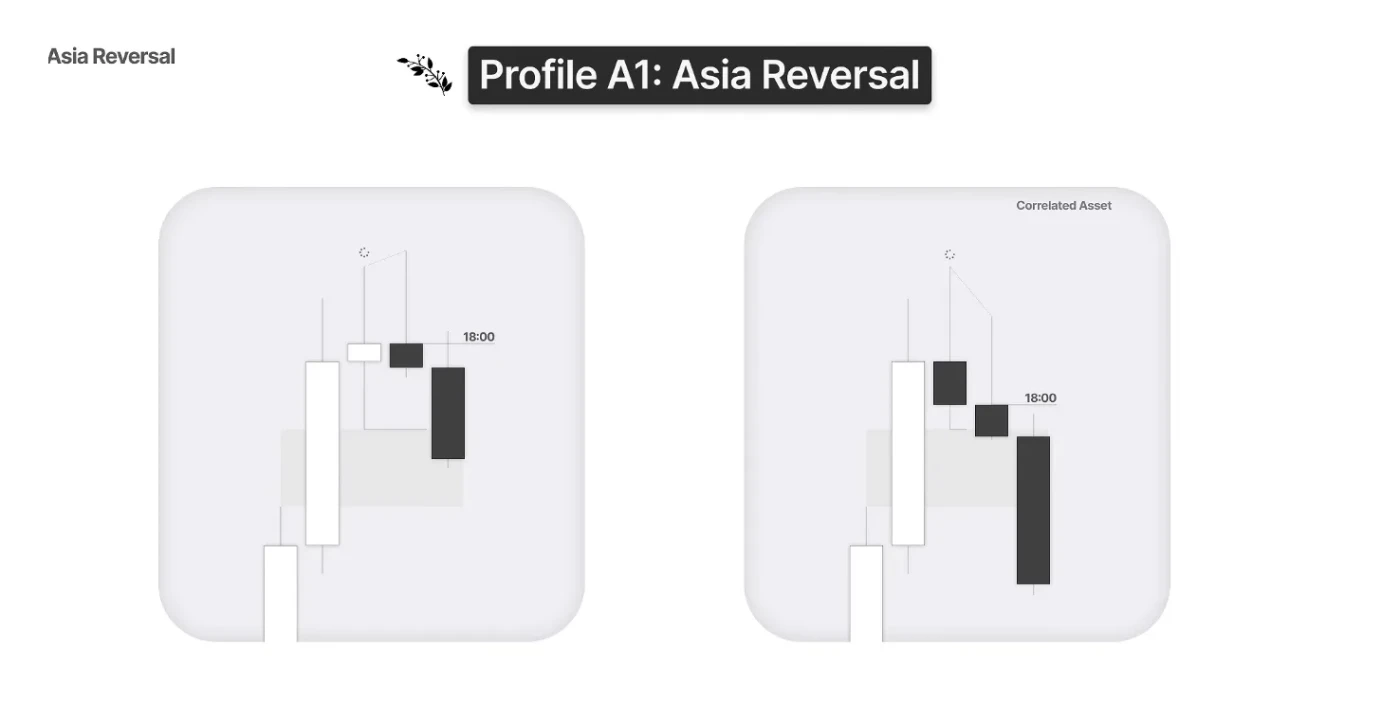
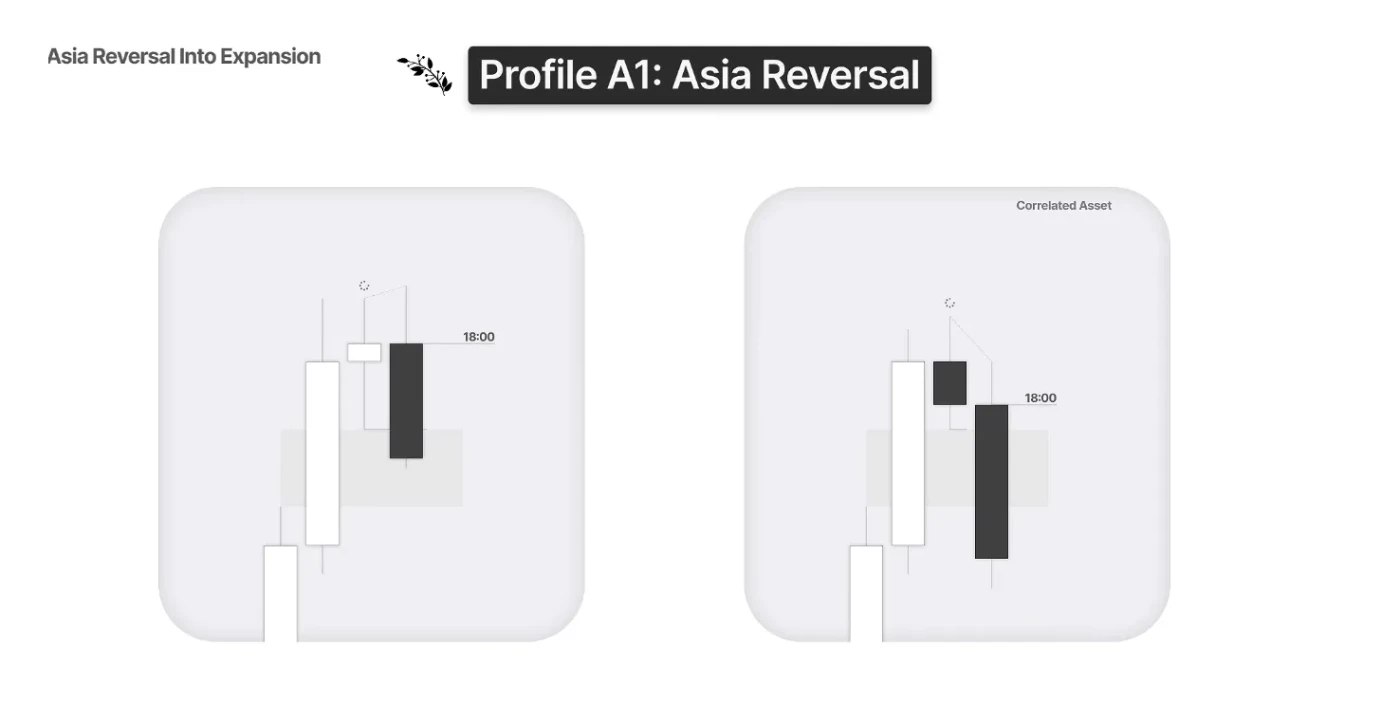
In an Asia reversal into expansion, look again at the relationship between wick size and body size. When the reversal candle has a large wick, the next candle, 22:00, expands. When the reversal has a small wick, we can anticipate that the reversal candle itself expands toward the draw on liquidity.
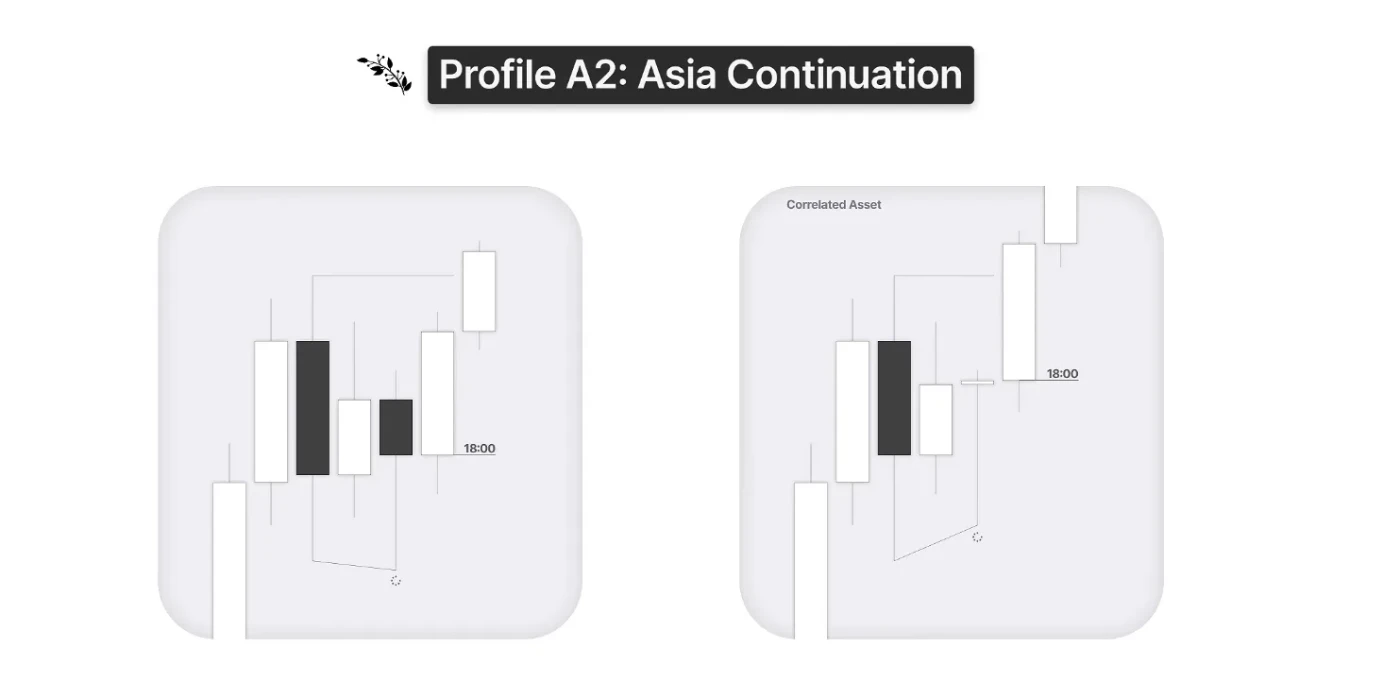
Asia continuations happen when the 14:00 (2 p.m.) candle of the previous day reverses. That PM session reversal is the protraction phase of the current daily candle, occurring in the previous day's close. When 14:00 reverses, 18:00, the daily open, can expand. We typically see this with the FOMC driver on FOMC Wednesdays, when the driver creates the extreme and Asia opens as a C3. The logic is the same: once the Candle 2 formation with its crack in correlation sequence is established, we can trade continuations with our defined invalidations away from that low (or high) of day. As a Market Maker Model, the previous day reverses, 18:00 expands, London consolidates, for example, and New York expands.
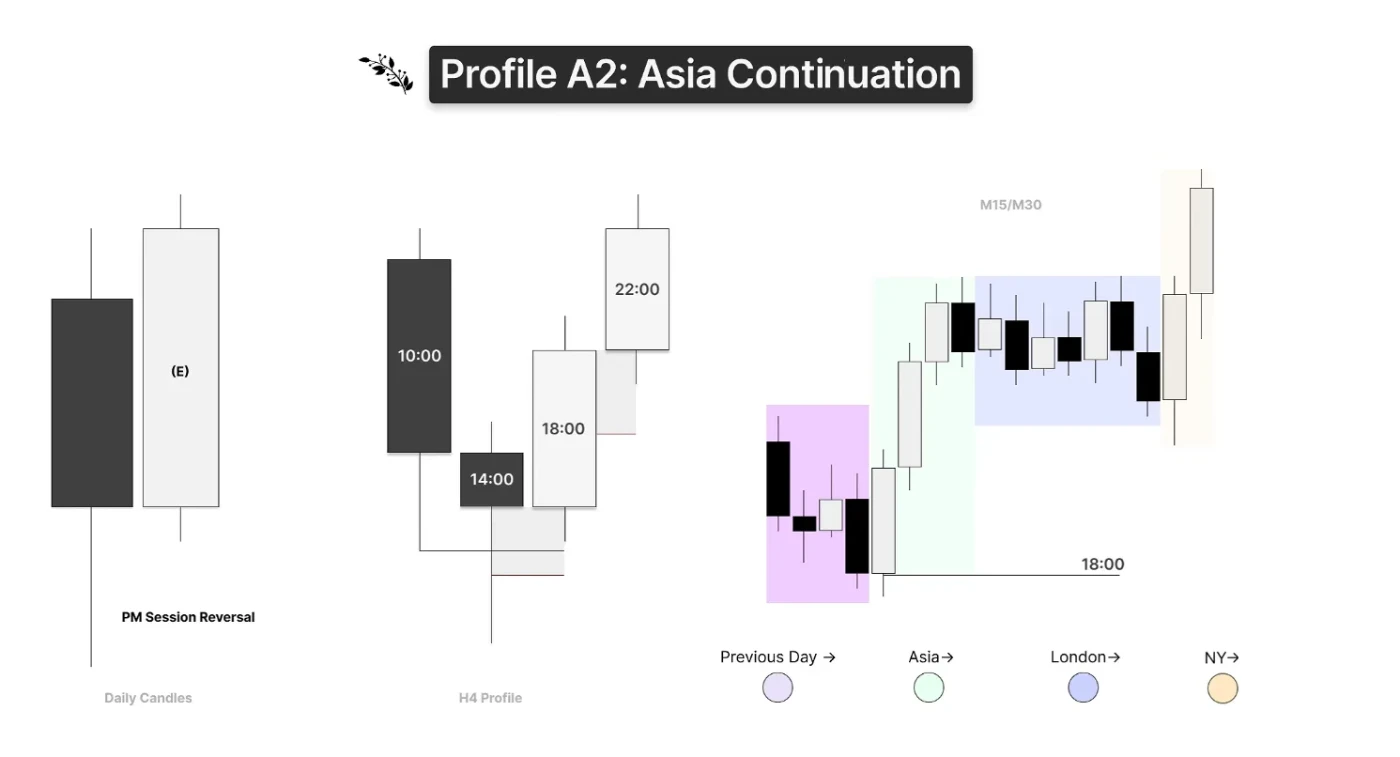
On the 4-hour profile: 14:00 forms the 2-stage PSP with a correlated asset, forming the daily reversal, and the next day opens as a C3 and expands toward the opposite side of the range or the draw on liquidity. This is frequently seen on FOMC days, or with those 2 p.m. manipulation drivers.
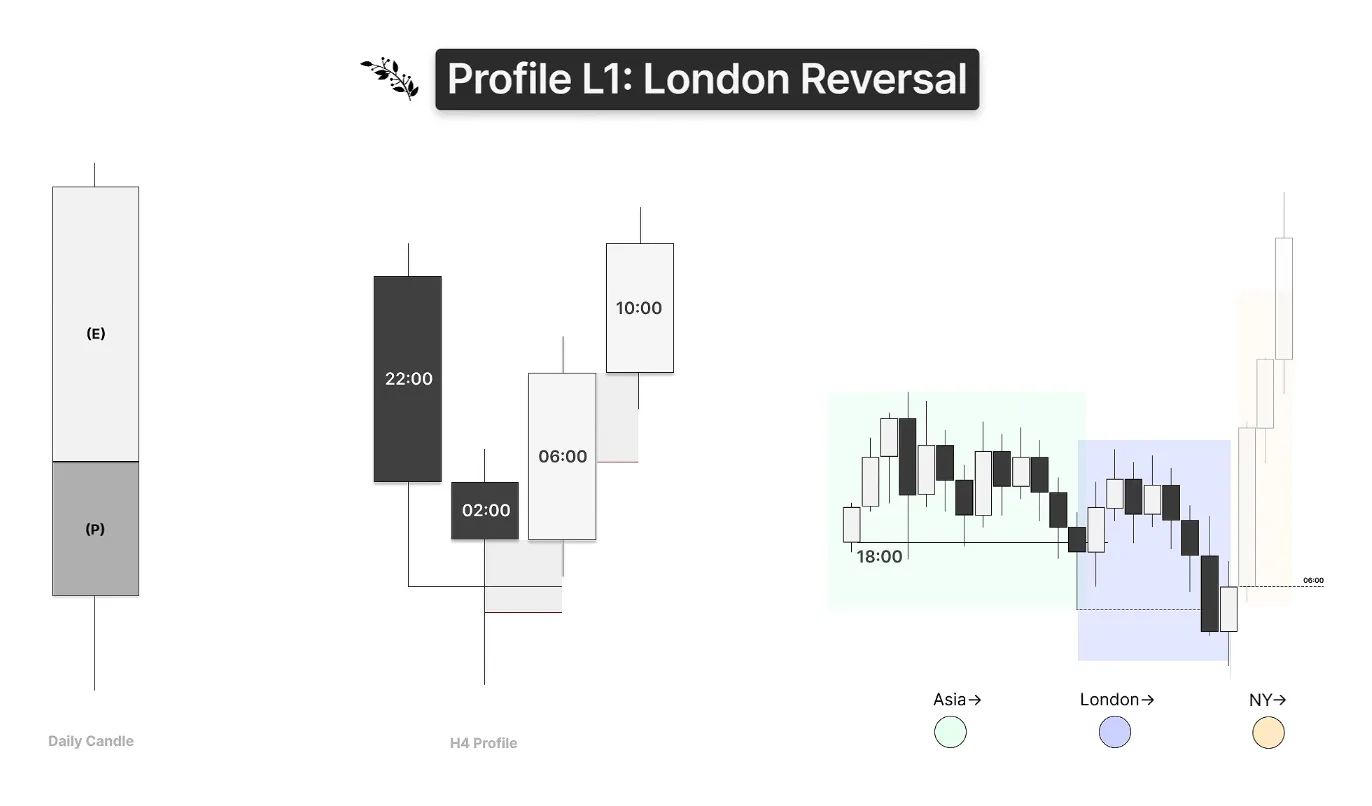
London reversals are typically where you can frame swing trades for the daily range: the protraction phase of the daily candle is defined by the 02:00 4-hour candle forming the reversal, and New York expands away from it. In the AMD, or Market Maker Model, sequence we have accumulation in Asia, manipulation of the Asian range and the reversal inside London, then expansion away from that low. There will be a 2-stage crack in correlation at the extreme wick to establish that the protraction phase has ended, then expansion in the following 4-hour candles.
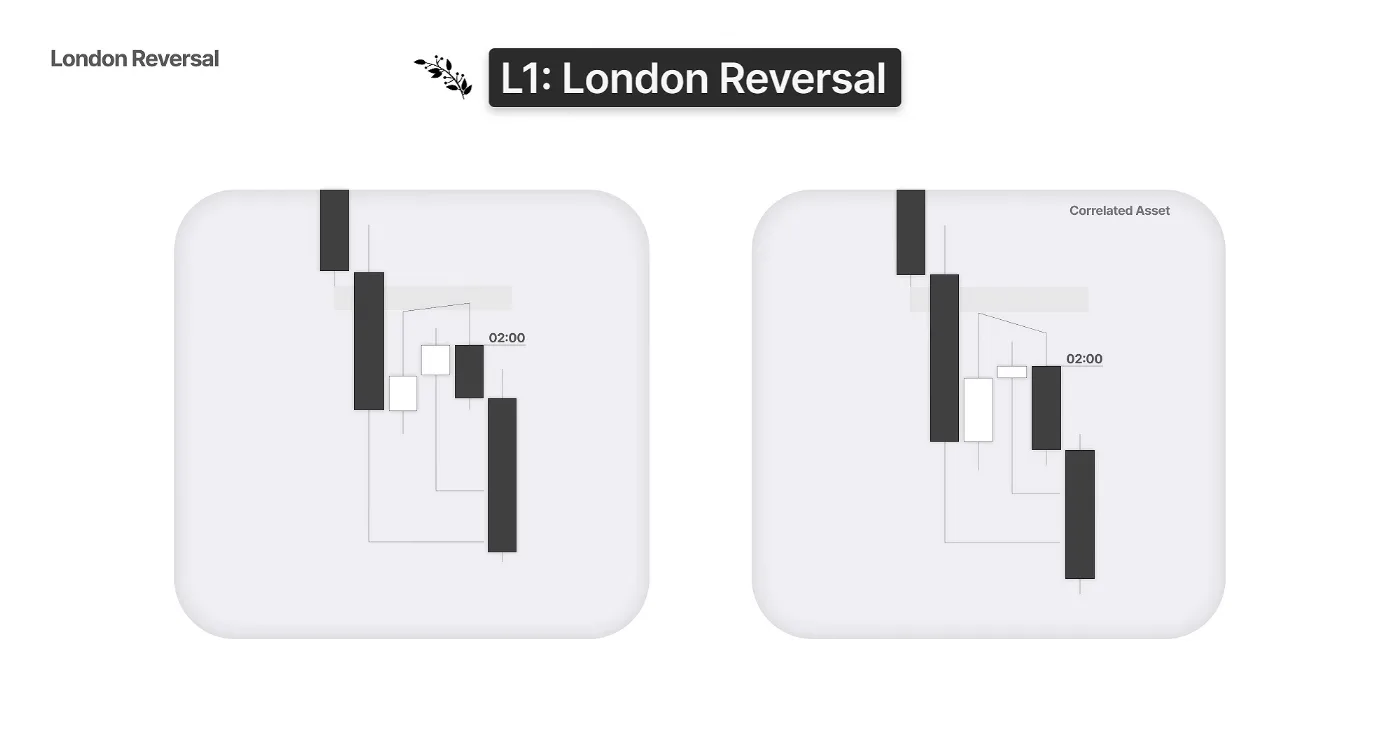
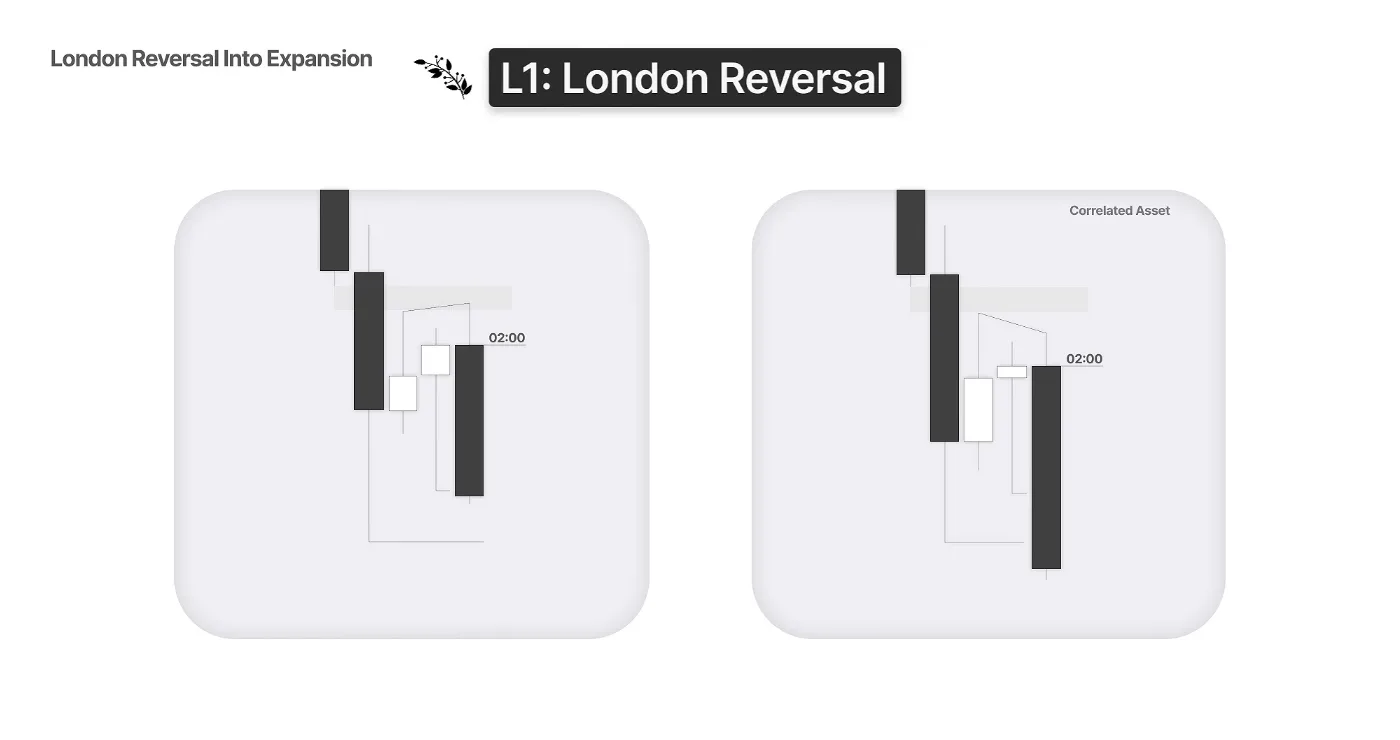
On your 4-hour profiles, 02:00 forms the 2-stage SMT from a key level. This can be on the 4 hour itself or, where the 4 hour does not show a 2-stage SMT, we go inside the candle and profile the reversal with a 30 minute, 1 hour or even 15 minute swing formation, such as a Strength Switch. In a London reversal into expansion the wick size matters the same way: a small wick reversal in London means the 02:00 candle itself can be the expansion candle; a larger wick means we look for the next 4-hour session, New York (06:00 or 10:00), to expand.
New York reversals are really driver-paired reversals: red folder news like CPI and NFP, as well as the equities open at 9:30, form the low or high of day from the 4-hour swing at either 06:00 or 10:00. That is when the daily protraction phase forms in the 6 a.m. or 10 a.m. candle. Asia and London may consolidate, and then New York forms the swing and expands away: it can reverse into expansion, or reverse and expand in the next candle.
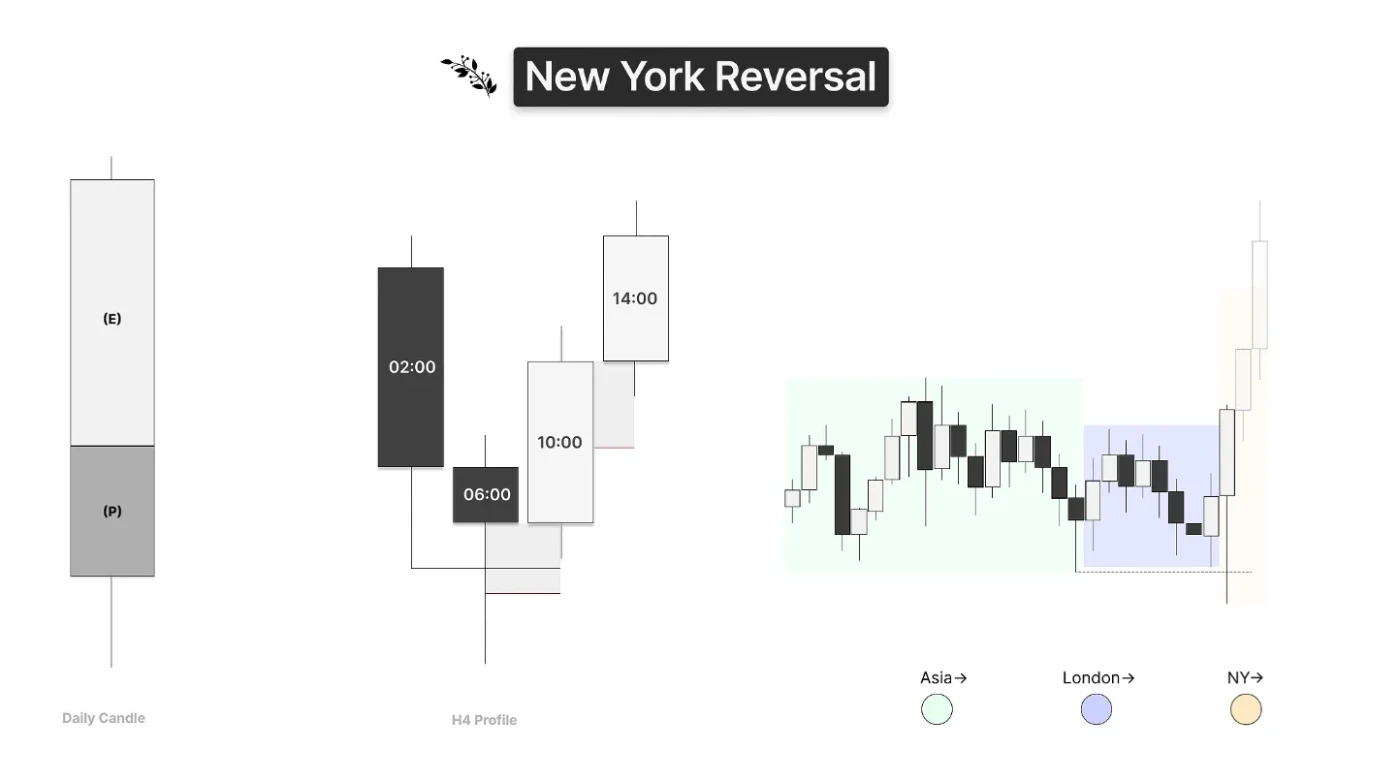
On the 4-hour profiles, we might have a 2-stage PSP at 6 a.m. with 10 a.m. expanding, or the 6 a.m. driver itself offering a small wick, typically at the equities open, into expansion. In the first schematic the 4 hour is itself a 2-stage, a PSP confirming an SMT, so we can trade Candle 3. In the reversal to expansion case, we profile the low with a second-stage crack in correlation to confirm it, which you are already comfortable doing from previous lectures.
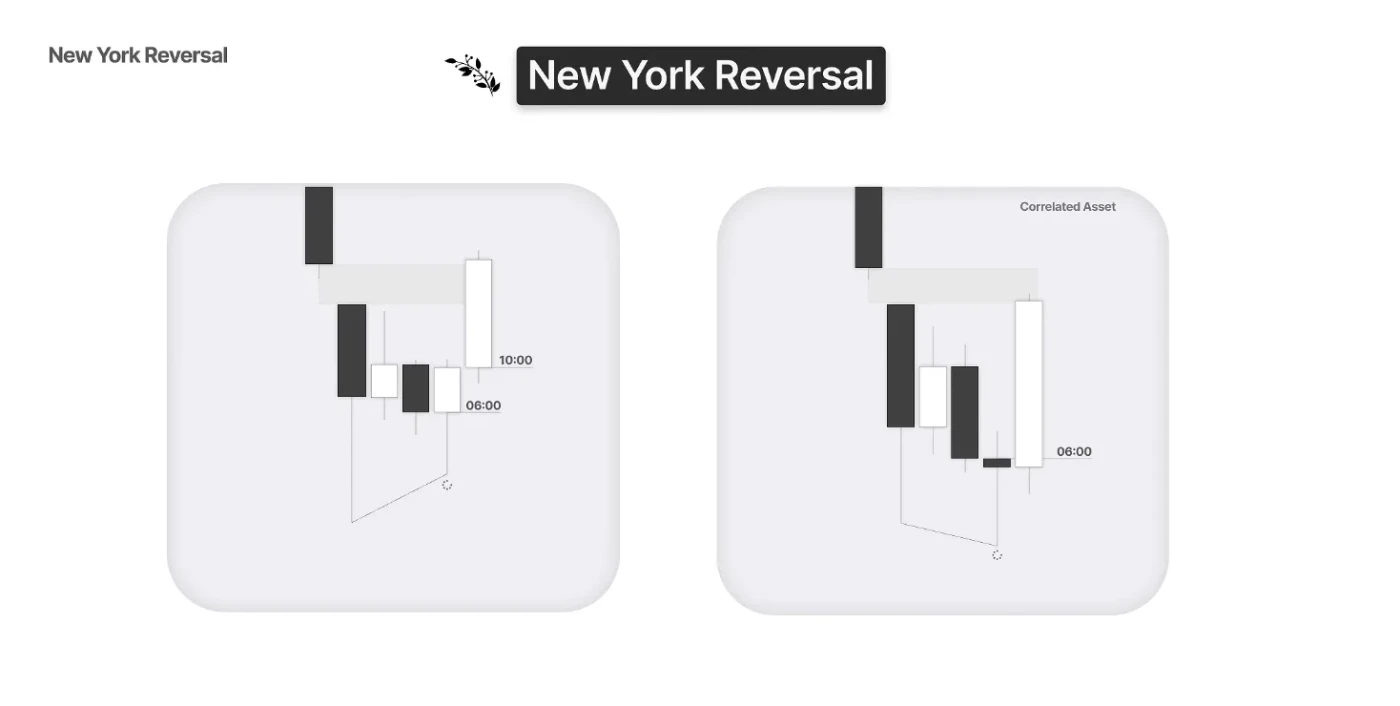
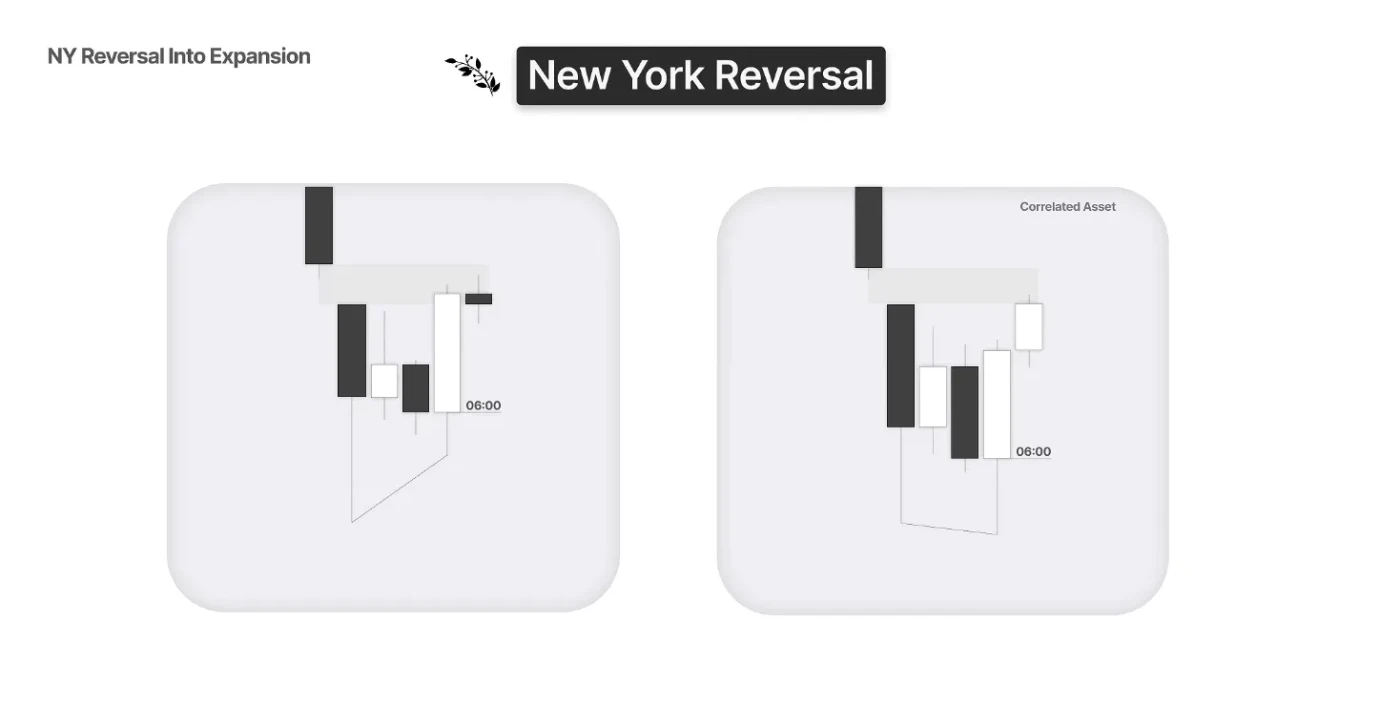
The chart examples were all live-conducted examples, so please refer to 33:25 in the YouTube video accessible on the right-hand side of this page.
Learning it alone isn’t easy...
Learn The Lathyrus Model with direct guidance from our coaches.
- 10 live streams every week
- Regularly updated in-depth course
- 450+ hours of live stream recordings
+ more
Delayed Protraction And Large Wick Session Profiles
This final chapter is a bit more complex: delayed protraction, the larger wick session profiles. Look beyond the patterns and seek the logic. There is a big difference between recognizing a certain type of candle and being able to trade that candle as it develops, so focus on the logic and the sequences behind these profiles, so you can see and trade them in real time.
There is a difference between the expansion expectation for a candle with a small wick and for a candle with a larger wick.
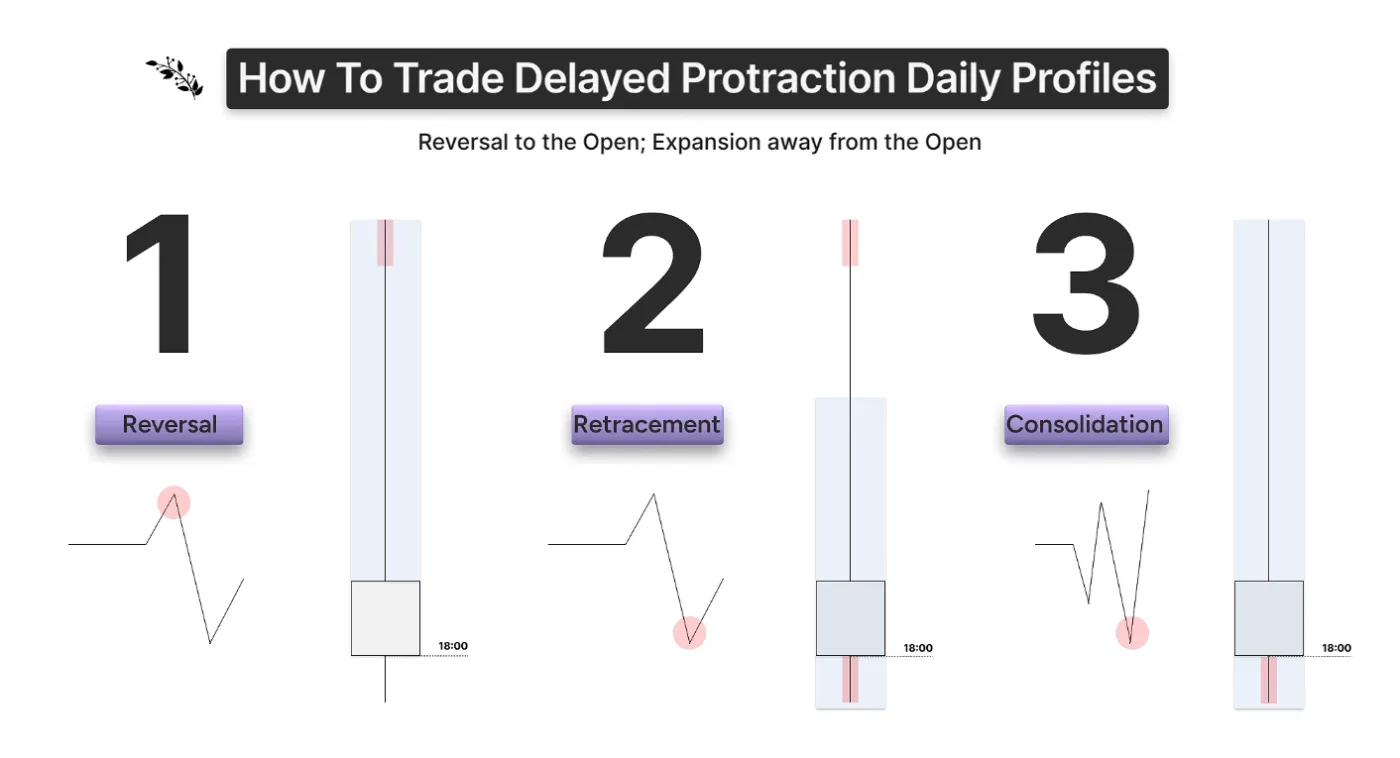
When trading delayed protraction, recognize that moves beyond the opening price, deviations above and below it, look extremely specific with this profile. There are three ways to trade a candle that we know will not support expansion, and each correlates with a phase of price within the candle:
- Reversals to the opening price of large wick candles.
- Retracements away from the opening price of large wick candles, back into the wick.
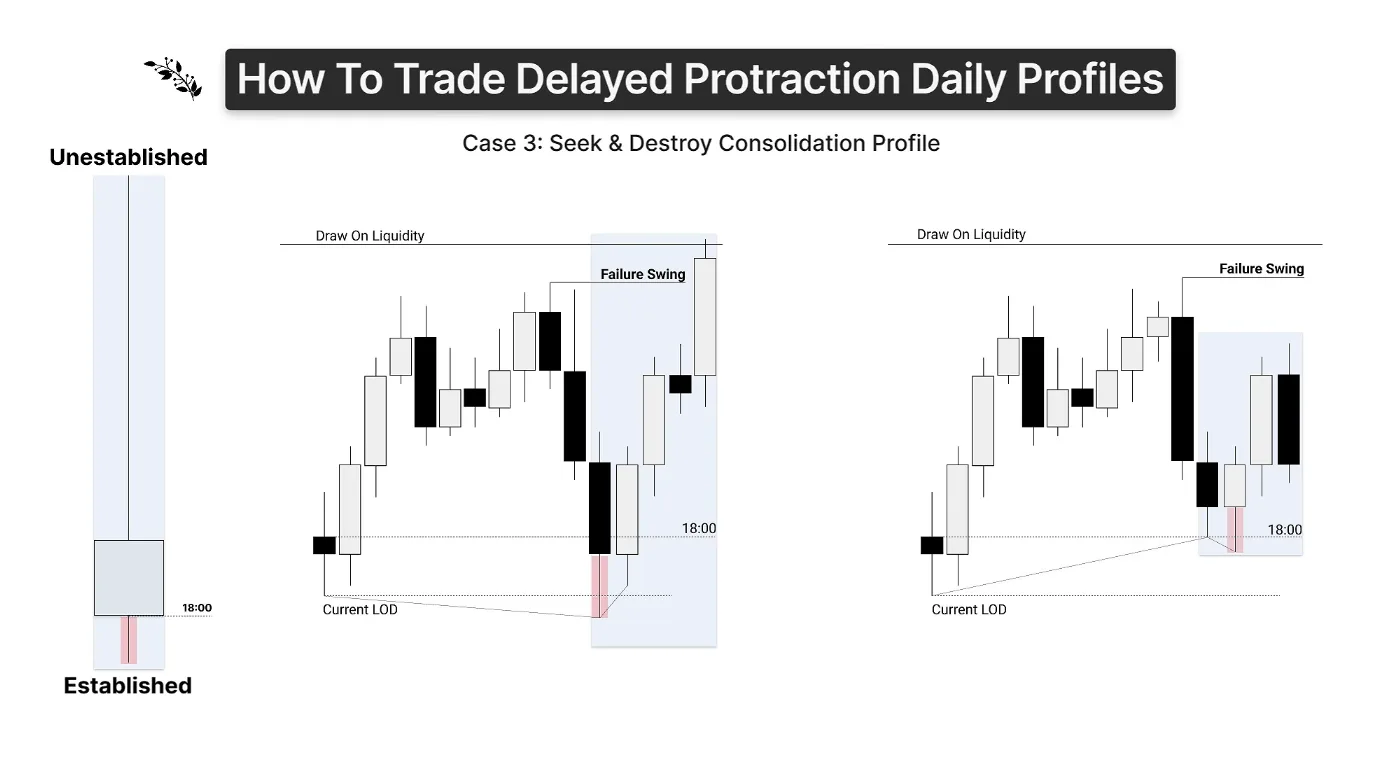
- Consolidation, specifically seek and destroy profiles.
First we need to establish what an extreme is, and whether we can trust it. When you see the red line denoting an established extreme, it was formed from a 2-stage crack in correlation with an associated lower time frame swing. We have used 4-hour charts in this lecture, so an established low or high of a delayed protraction candle means there is a 2-stage crack in correlation on a C2 or C3 fractal we have defined that forms it. We trade away from the established extremes toward the unestablished ones.
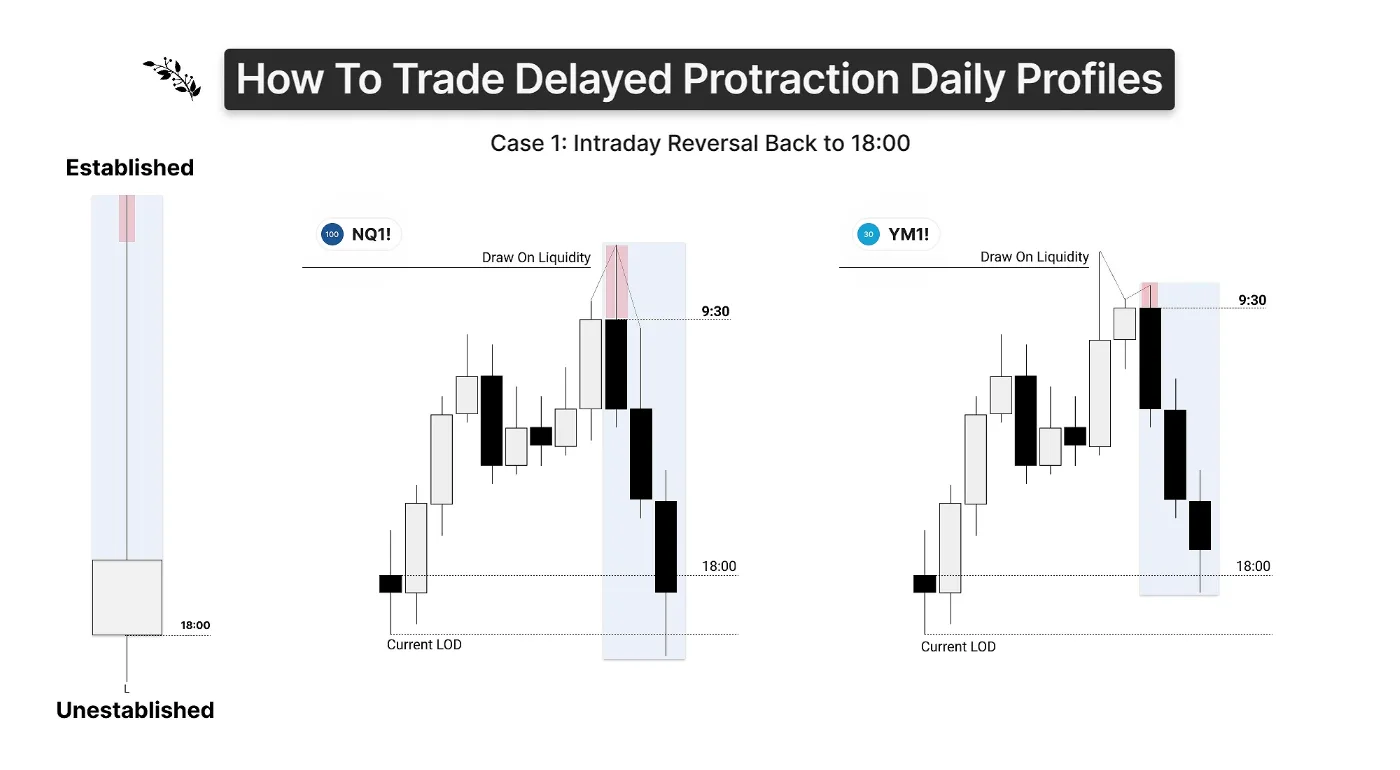
Case 1: an intraday reversal back to 18:00. Price opens and forms a low of day that is unestablished, with no 2-stage crack in correlation or associated swing formation, then trades away from the opening price into a draw on liquidity and forms a very large wick. The opportunity is the established high formed with a 2-stage SMT: we trade back as a reversal to the opening price, potentially even to the unestablished current low of the day. What we do not want to do is trade it as an expansion candle, flipping through its open and expanding deeper into the range. The large wick filters out a large body, so we trade the reversal from the established high (or low, for a bearish candle) back to the open. The universal model here is ERL to ERL, or to the open: a reversal phase of price.
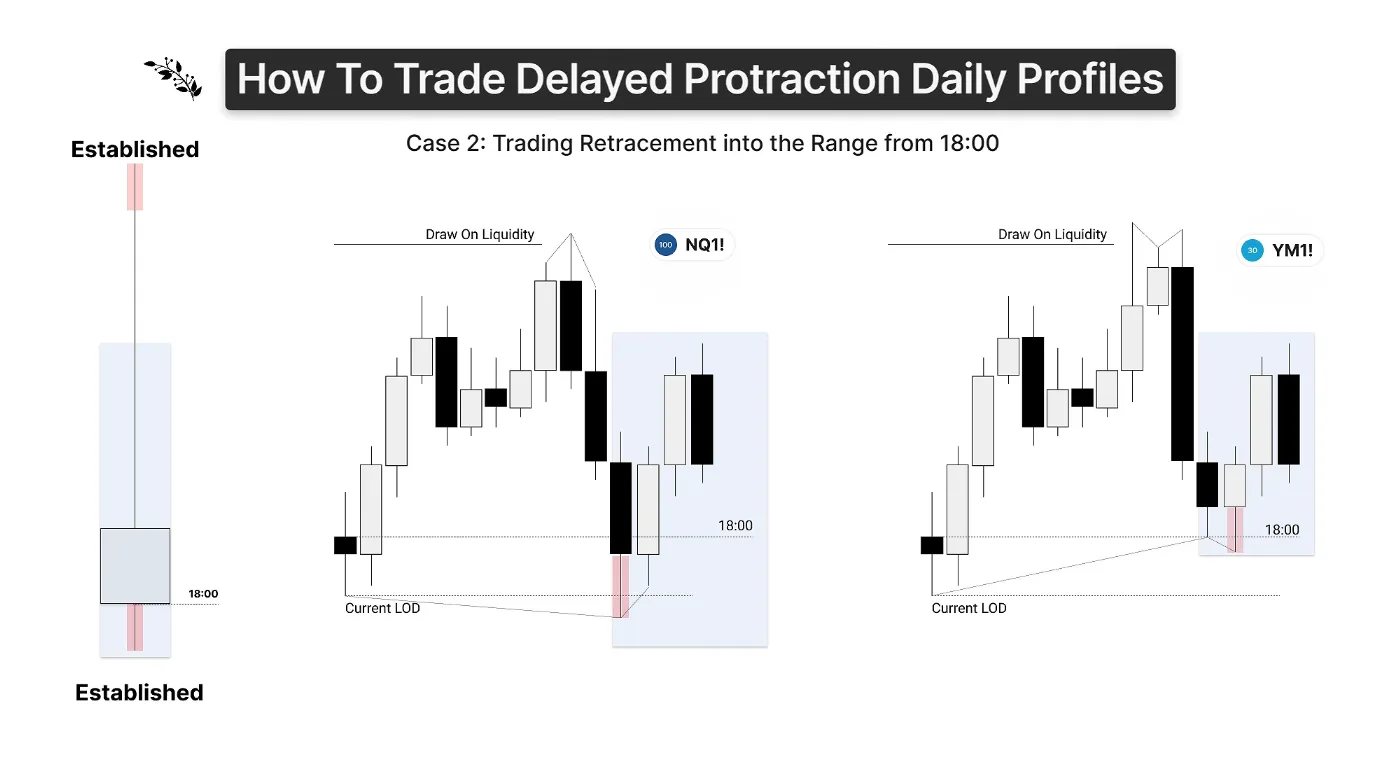
Case 2: a retracement back into the range once both the high and low are established. In case 1, after the established high, price reverses into the current low of day and forms SMT with a correlated asset. Because price is unlikely to expand through its open with that large wick, we can now trade a retracement back into the range. The universal model is ERL to IRL, a retracement: essentially we are trading the body closure of the large wick candle.
Case 3: seek and destroy, where the highs and lows are unestablished. We open, do not create an established low, trade into a failure swing high at the draw on liquidity, form an established low, and then draw into that high. It looks like opening high and leaving an objective, trading back into the low to create a broadening, seek and destroy formation, and then trading to that high. This is a consolidation phase of price: we target an unestablished level from an established level, but we are ranging, and we do not anticipate price expanding beyond the highs or the lows, based on the wick size and the profile.
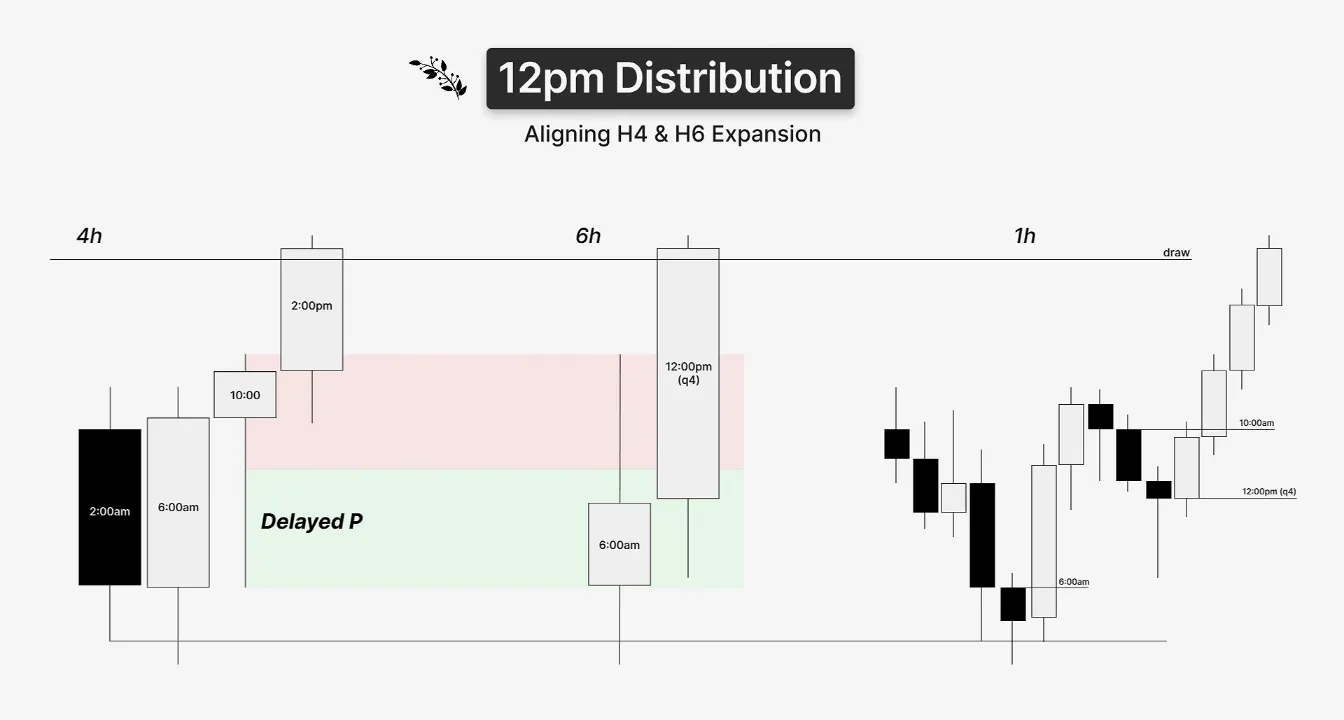
Using the 6-hour and 90-minute charts to time delayed protraction. Here we take advantage of the fact that a large wick on the 4-hour chart is formed through the body of a new 6-hour candle. We use the 6-hour and 90-minute charts when a 4-hour candle has a delayed protraction. If I am bullish and 6 a.m. forms a New York reversal, my profile expects 10 a.m. to expand. If 10 a.m. opens low with a large wick, I know that candle is itself a delayed protraction and unlikely to expand through its open. So I wait for the 6 a.m. 6-hour candle to close; its wick is that 10 a.m. large wick. The new 6-hour open at 12 p.m. encapsulates the wick forming on the 4 hour and gives you the expansion from 12 p.m. to 6 p.m.
Why not just wait for the new 4-hour candle? It comes down to where the reversal forms and the range. If the reversal forms at 6 a.m., you want to be involved early in the range, in discount, not buying in deep premium when 2 p.m. opens. You are taking advantage of the deep retracement 10 a.m. offers and asking where it ends: when the new 6-hour candle opens at 12 p.m., Q4, where you can position yourself inside the 4-hour wick and be involved in the 6-hour expansion. The bearish case is the same: the high of day forms with a New York reversal at 6 a.m., 10 a.m. opens high with a large wick, and we use the 12 p.m. Q4 to get back on side with the expansion inside the larger body.
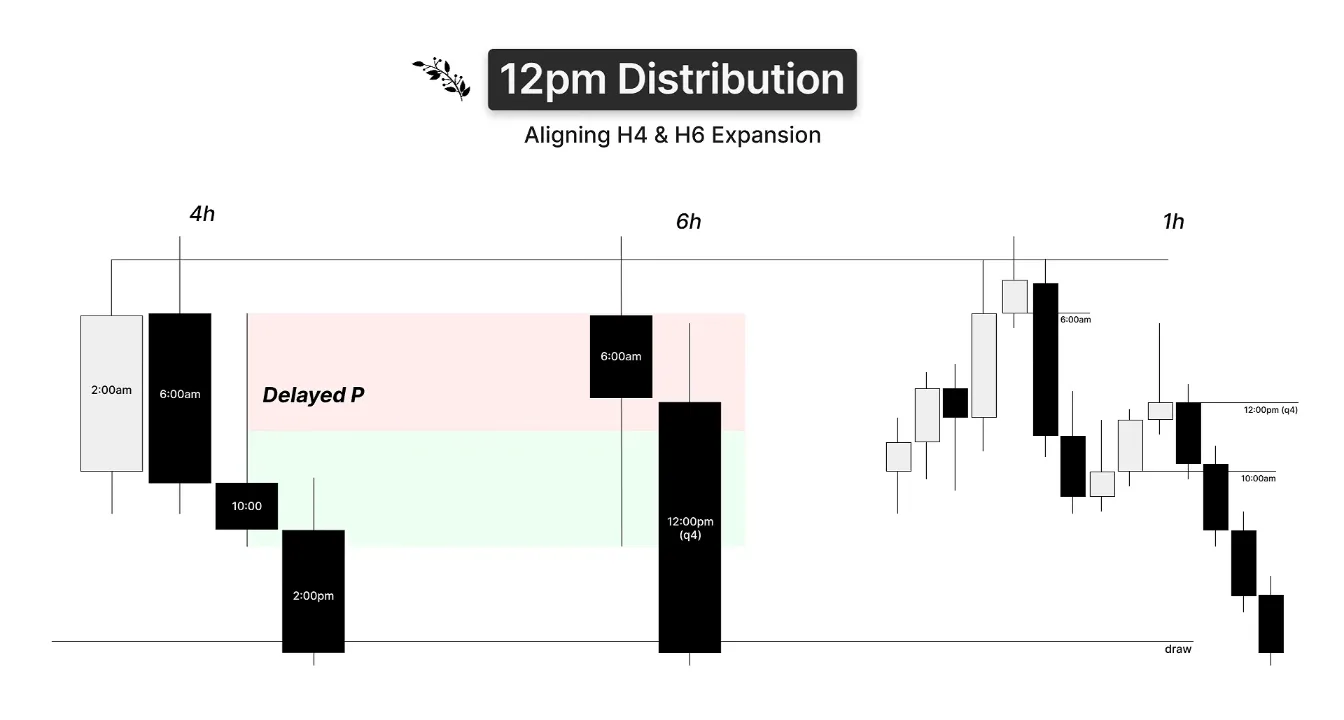
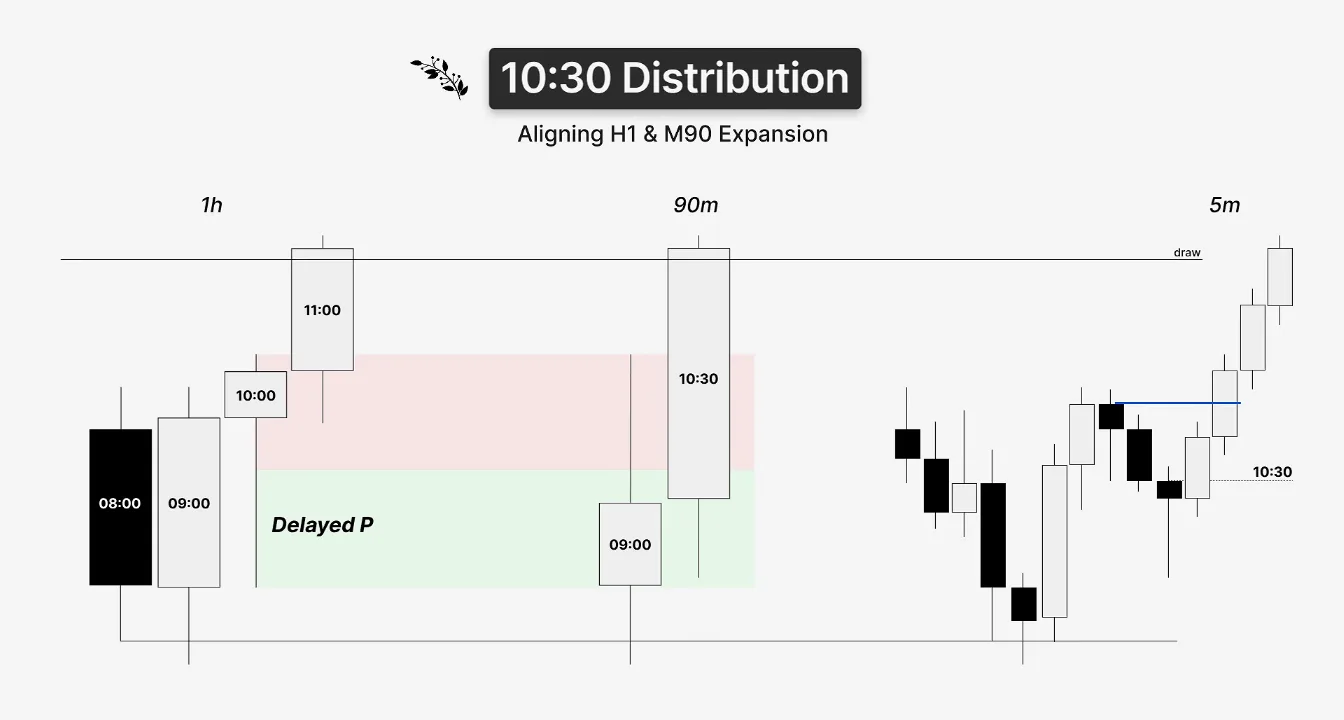
For 10:30 distributions we use the same logic with the 1-hour and 90-minute charts. If 9 a.m. forms the reversal and 10 a.m. opens low with a very large wick, we can typically use 10:30 to realign price and get on side. When to wait for 12 p.m. and when for 10:30 comes down to the size of the 10 a.m. wick and when it reverses. Waiting for 12 p.m., the exaggerated move might take several hours to protract before 12 p.m. opens in a swing formation and expands. With the 90-minute chart we may only manipulate from 10:00 to 10:30, so 10:30 is already expanding; then we do not wait for noon, we get involved before the 10 a.m. candle flips its open. If we reverse early in the 10 a.m. candle, use 10:30; if we reverse later in it, we prefer noon. In the bearish case, we form the reversal, 10 a.m. opens with the large wick, and the CISD sequence at 10:30 confirms the swing formation to get on side toward the draw.
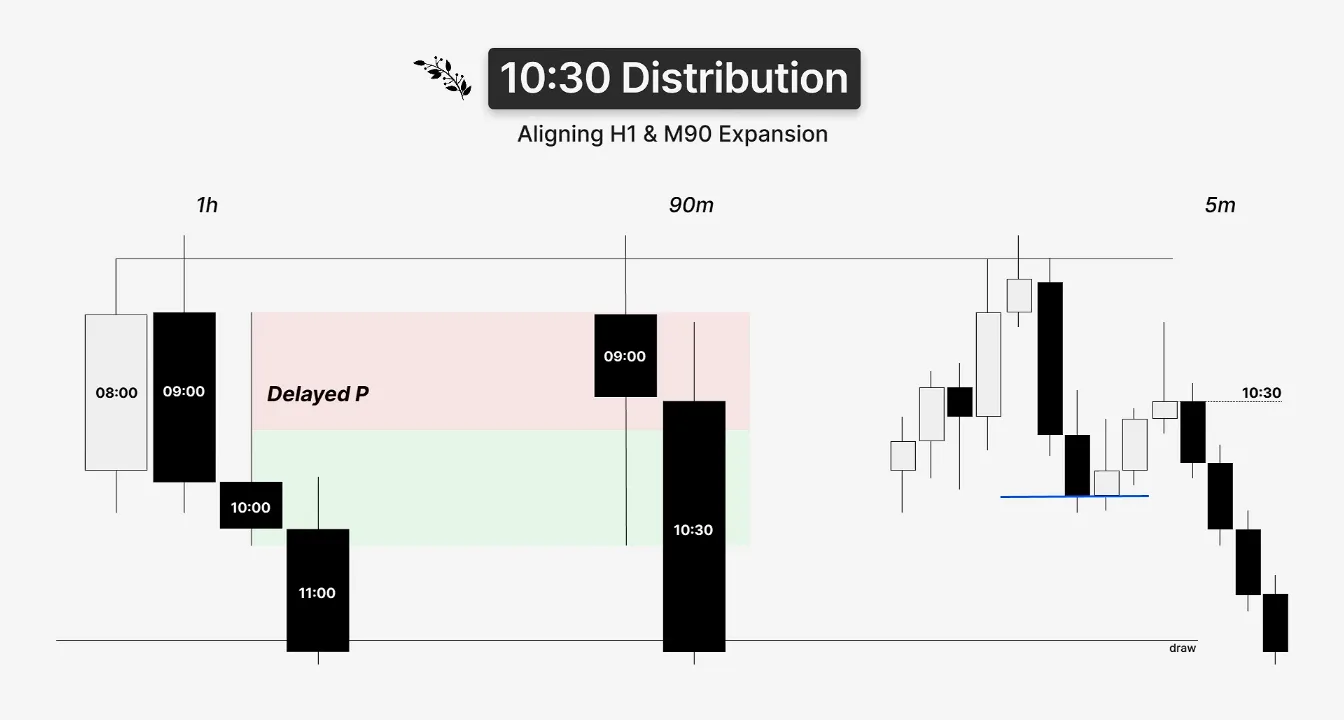
Everything here about 4-hour and 6-hour candles can also be reversed: a large 6-hour wick can use a new 4-hour open to get on side, and a large 90-minute wick can use a new 1-hour open. They are interchangeable; it is simply about timing these large wicks.
The chart examples were all live-conducted examples, so please refer to 57:29 in the YouTube video accessible on the right-hand side of this page.
Understanding profiling, or any of these concepts, in theory, and recognizing and executing on them while a candle is actually forming, are two very different skills. The second requires repetition, structured feedback and real chart time, so build on what you learned here today.
That's the end of this lecture, I hope you found value reading this and you learned something new that you can apply, or further refined your knowledge on this subject.
Back to the top