Introduction
The topics we cover are:
- Correlated assets
- Key levels
- The types of SMT
- The Strength Switch
- Premium and discount, with a little bit of advanced premium and discount
- Entry signatures
Let's jump right into it.
Everything You Need To Know About SMT
Introduction To SMT
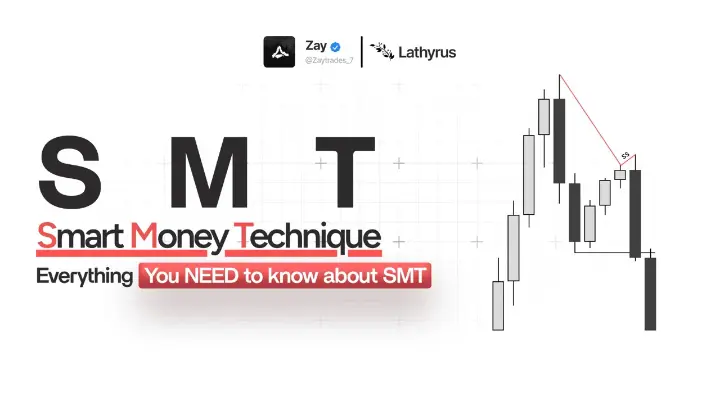
We use SMTs to confirm swing points. After we hit a key level, we ideally have an SMT on it, and we can use that to confirm the expansion and expect a new phase of price to be placed in the market. Everything below builds up to that: which assets to compare, which levels matter, what the SMTs look like, and how to filter the ones that will hold from the ones that will break.
Correlated Assets
Correlated assets are very simple. They are the assets that move in tandem, meaning in the same direction in a similar way. The only three triads we use are indices, metals and energies.
- Indices: NQ, ES and YM.
- Metals: Gold, Silver and the forex pairs.
- Energies: CL, RB and HO.
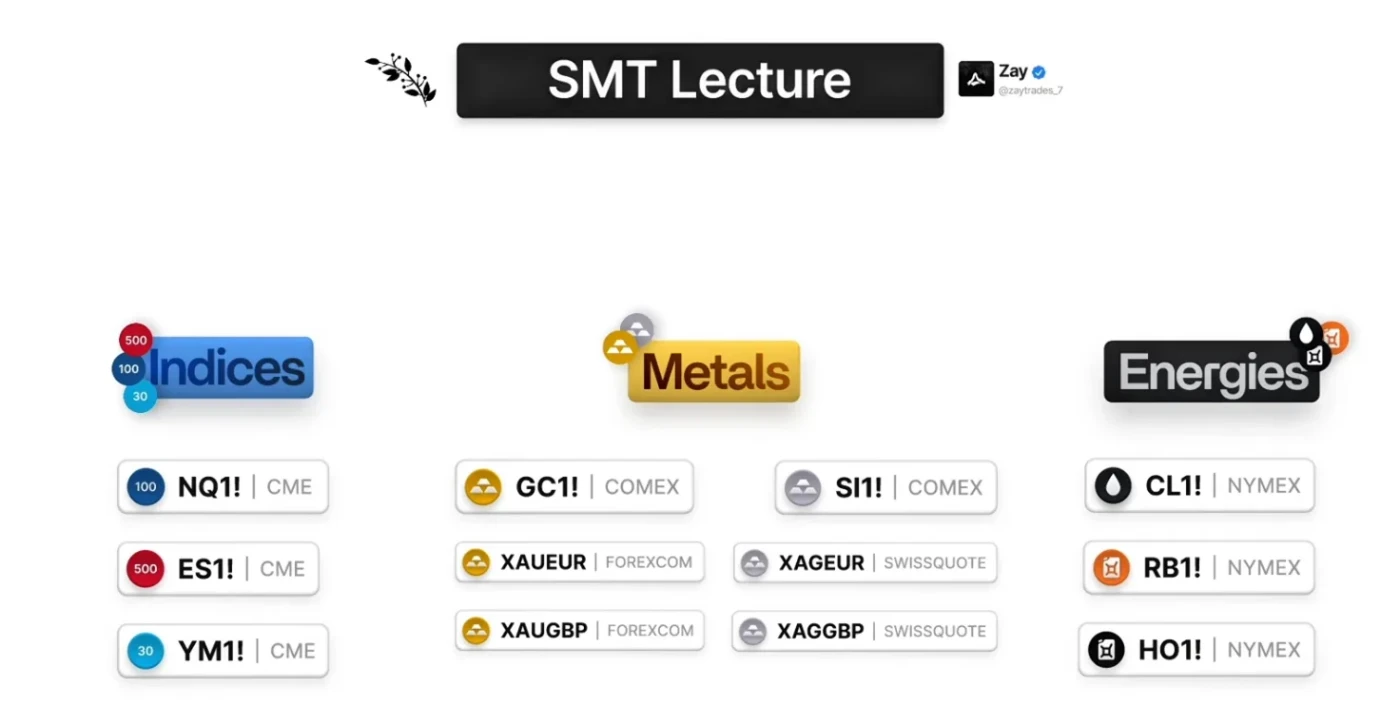
Two things to know before we move on to key levels. First, indices and metals usually move in the same direction: if indices are going up, metals are probably going up most of the time. Energies, on the other hand, move in the opposite direction: if indices are going up, energies are going down.
Second, on metals we do not use gold against XAG/EUR for SMTs. To frame an SMT on gold we use gold, XAU/EUR, XAU/GBP and then silver. To frame an SMT on silver we use silver, XAG/EUR, XAG/GBP and then gold.
Key Levels And Swing Formations
Key levels are the most important thing in your trading, because if there is no key level, there is no trade. We always want to be trading away from key levels, framing the swing points away from these levels. And these levels are just two things: relevant swings and gaps. Relevant swings are relevant highs and lows, and gaps are just gaps.
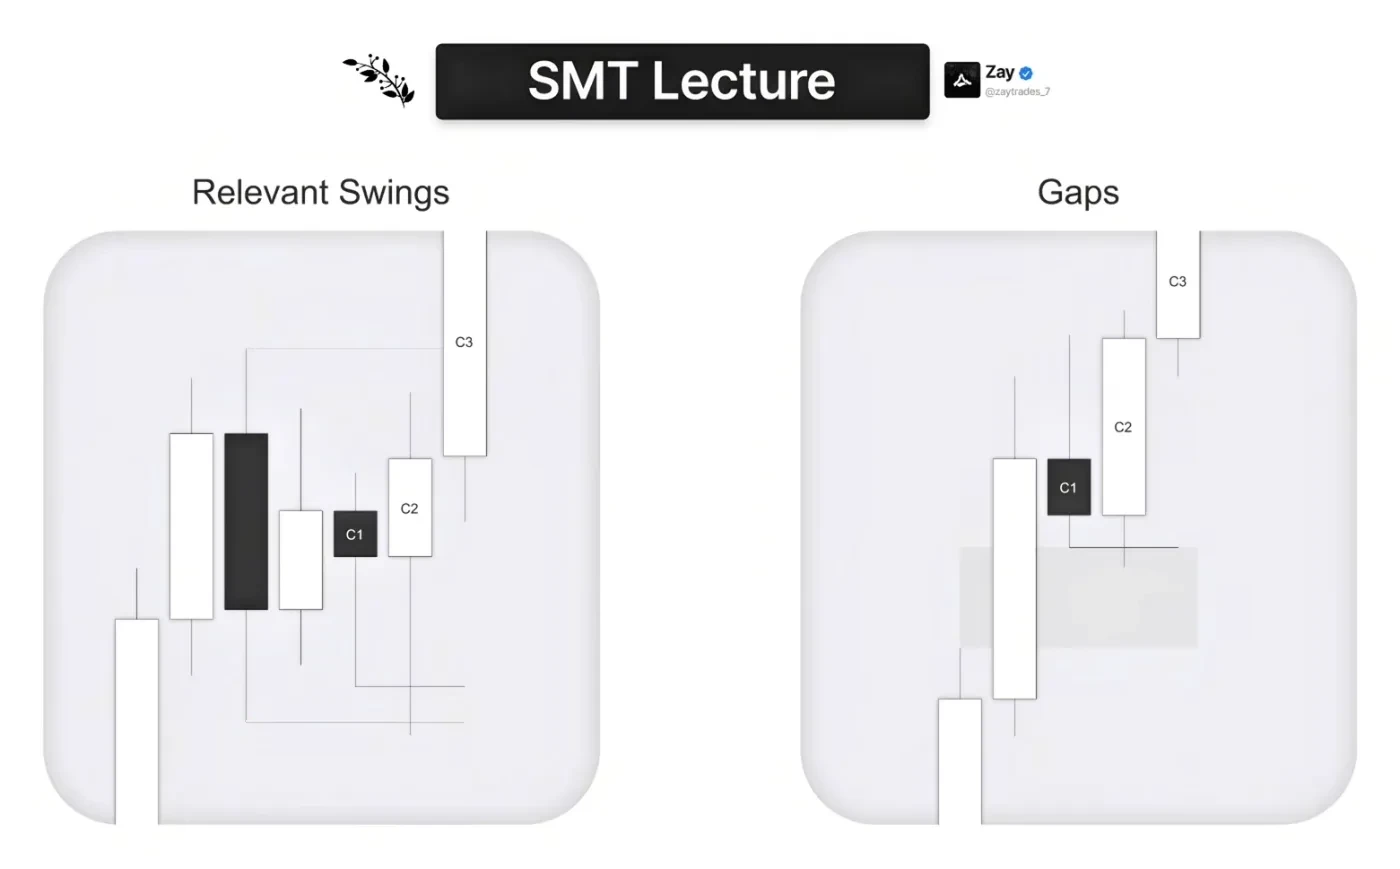
In the example on the left, we are coming away from an expansion, clearly expanding, but then we stall. Maybe what caused this to stop expanding was that we hit a relevant high on the left, and we entered a new phase of price, which is consolidation. How do we know it is consolidation? Because we are inside the range between this high and this low. And since there is no other high to the left and no other low, with enough distance between this low and the next low, this high and this low are the relevant swings in the market. These are our key levels.
On the C2 candle marked out, we end up stabbing through this low, and that is when we can frame a trade. We would not be framing a long here before it swept the low, because the low above is irrelevant, a failure swing to this low. It is only after we actually hit the low that we expand away from it.
On the right we have a gap. This is on the higher time frame, mainly the daily chart, maybe the 6 hour or 4 hour. Gaps are only formed after an expansion, so gaps are literally a sign of an expansion. We will almost always leave gaps after we expand. Even on the left we expanded away and most likely have a gap there, but we went into the gap and failed to expand away, so we entered a new phase of price, and that is why that low is now relevant. On the right we did not consolidate; we expanded away from the gap, which can also happen. That low is also a relevant low: it is the low we expanded away from, off the gap.
So these are the two key levels we care about. We do not care about anything else.
Learning it alone isn’t easy...
Learn The Lathyrus Model with direct guidance from our coaches.
- 10 live streams every week
- Regularly updated in-depth course
- 450+ hours of live stream recordings
+ more
Types Of SMT
We are going to go over the types of SMT. Obviously I am not going to show every single SMT and how it can happen, because there are thousands, and every one is different. You need to understand the logic behind them. Essentially, we use SMTs to confirm swing points: after we hit a key level we ideally have an SMT on it, and we use that to confirm the expansion and expect a new phase of price.
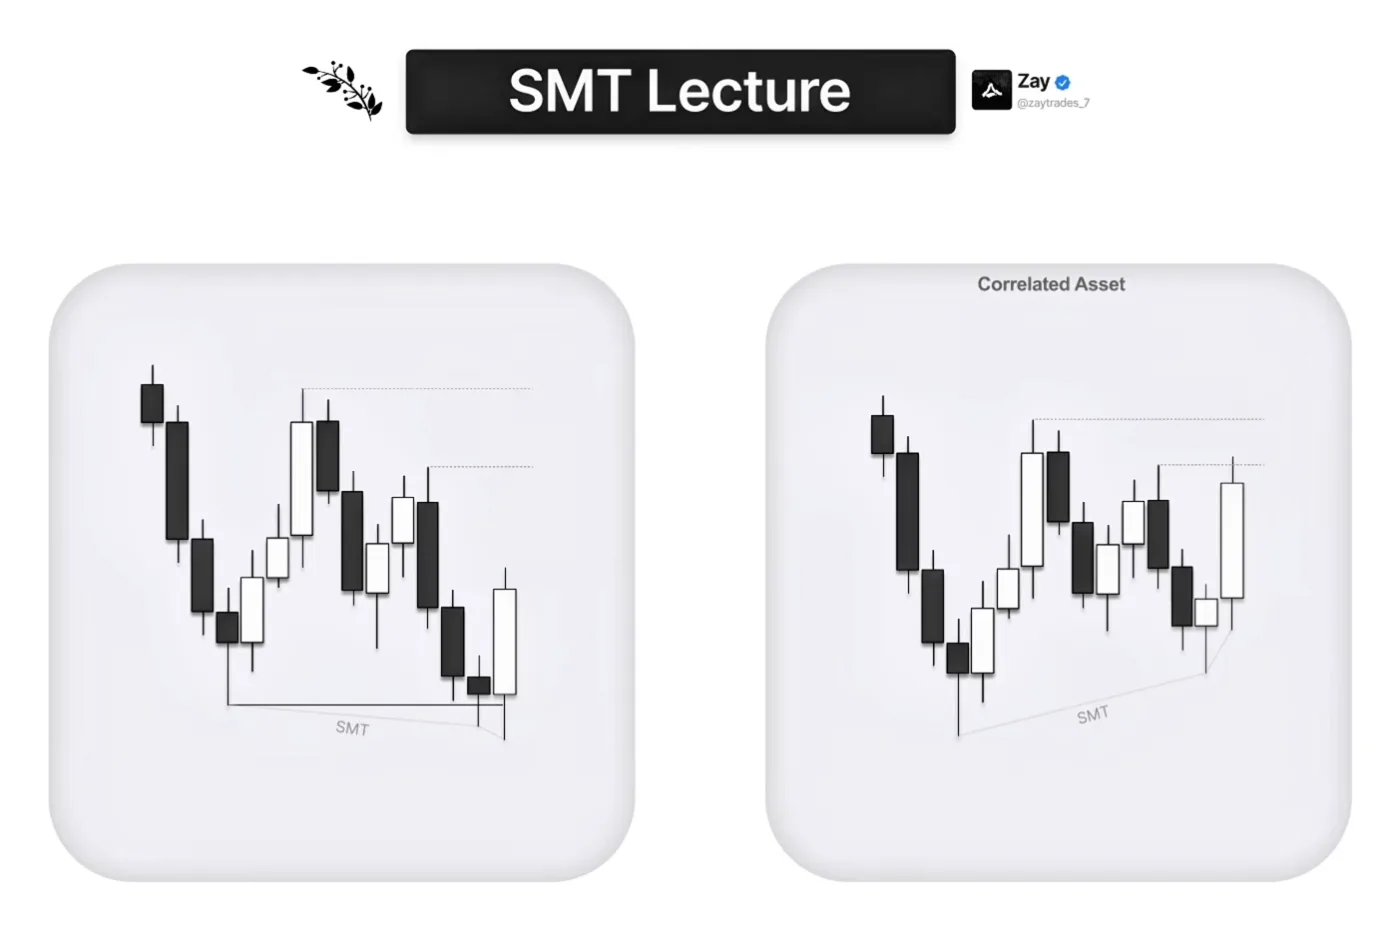
One-stage SMT. The simplest type, literally just one SMT. We have asset one and the correlated asset, say ES and NQ. On one asset we hit the relevant low, the key level. Why is it a key level? Because there is no other low to the left; it is the extreme of the range. On the other asset we do not hit the low. We failed to hit the low, so that asset is the stronger asset, the one that wants to go up the most. It did not even have the strength to come all the way down. That is how you use SMTs to know which asset to trade: if the framework was aligned for a long, we would be choosing the asset that did not hit the low. That is why SMTs are so powerful and why they confirm the next phase of price away from the key level.
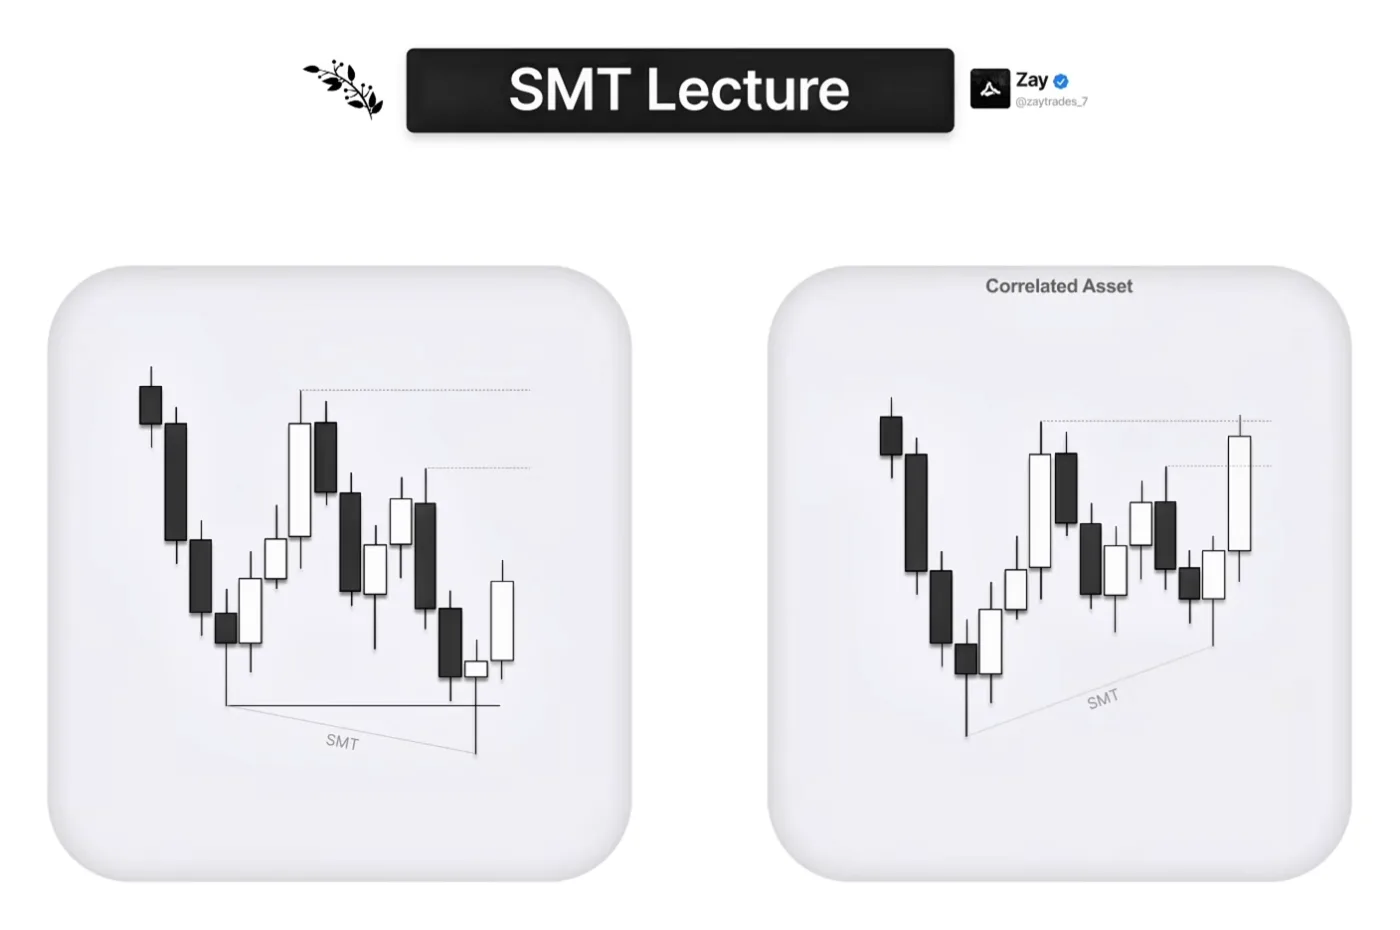
One-stage PSP. PSP means Precision Swing Point, and it is the simplest thing ever: one asset closes bearish and one asset closes bullish after we hit a key level. It does not have to be after; there are a bunch of ways PSPs can happen, but in this example it was after we hit the key level. Both assets hit the same key level, but one is the stronger asset because it closes bullish, and the other closes bearish. Why is this important? If you look at the PSP logically, the bearish-closing asset hit the low, put in the wick and expanded away from it, yes, but way less than the other asset. If we dropped to the lower time frame, the bullish-closing asset's candle would have a much more aggressive, cleaner V-shape, and the other asset would be lethargic: it did not expand away from the low as much, which is why it closed bearish. So the bullish-closing asset is the best asset to trade for a long.
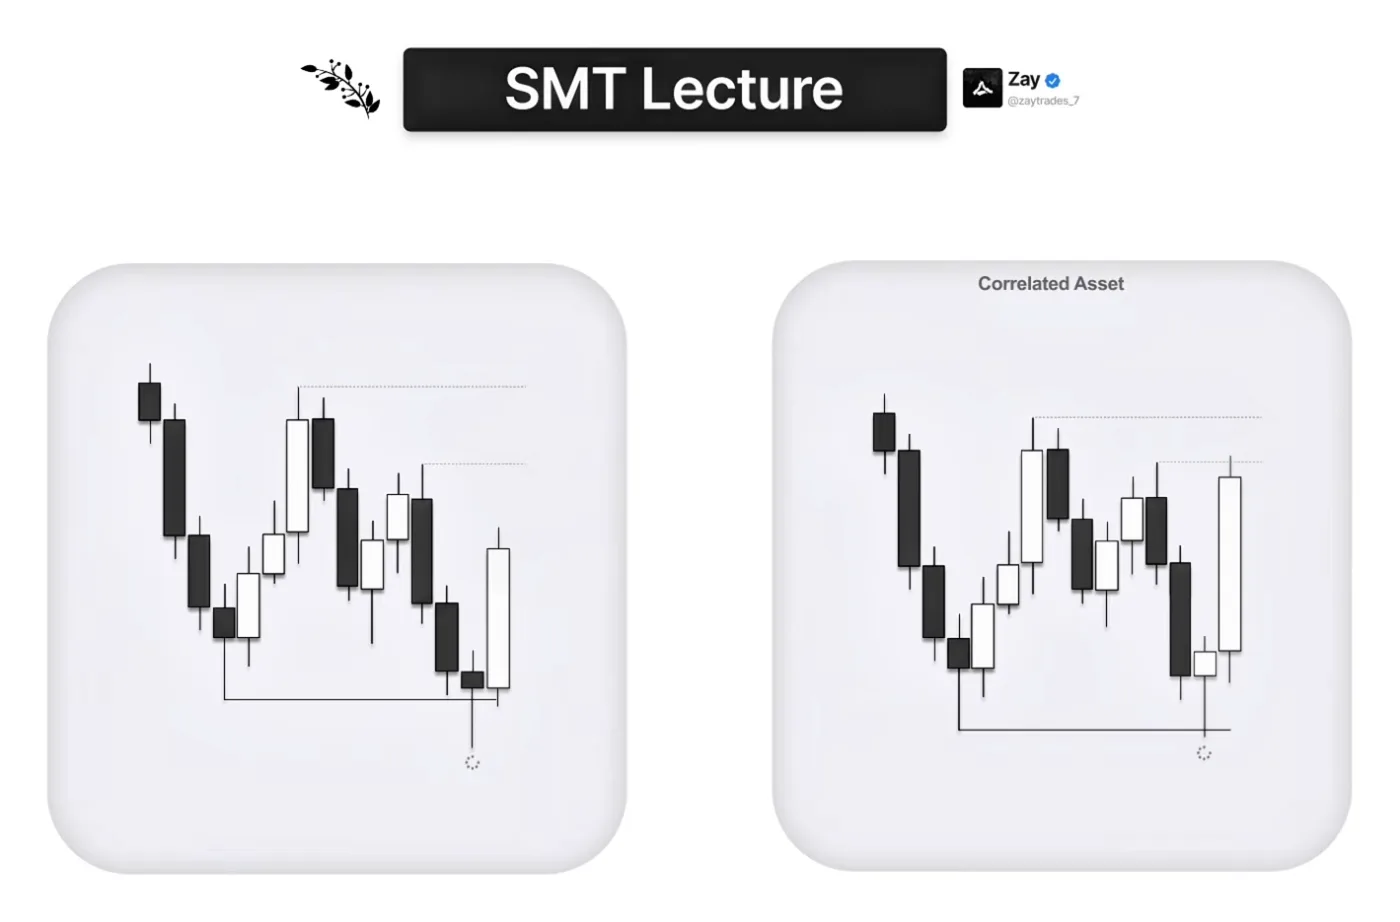
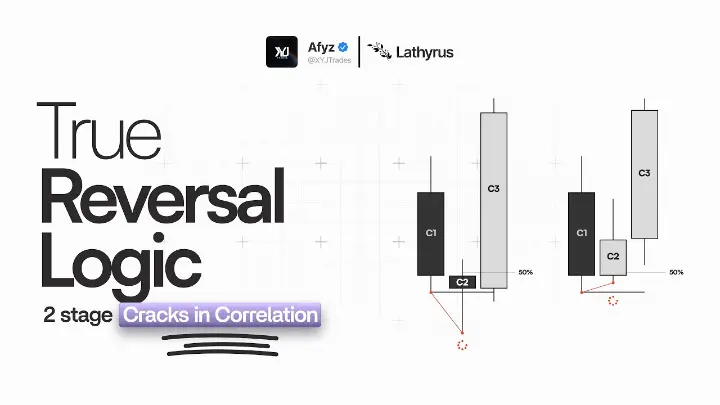
2-stage SMT. Pretty easy as well. This is the worst type of 2-stage SMT we want to see, because we take out the low and then take out the low again; ideally it comes in the form of a Strength Switch, which we go over in a bit. The 2-stage SMT is simply when one asset takes out the low and the other does not, and then, instead of just expanding away from that initial higher time frame SMT, we take out the low again, forming the 2-stage crack in correlation, and then expand away from it. It is slightly more probable than the one-stage SMT.
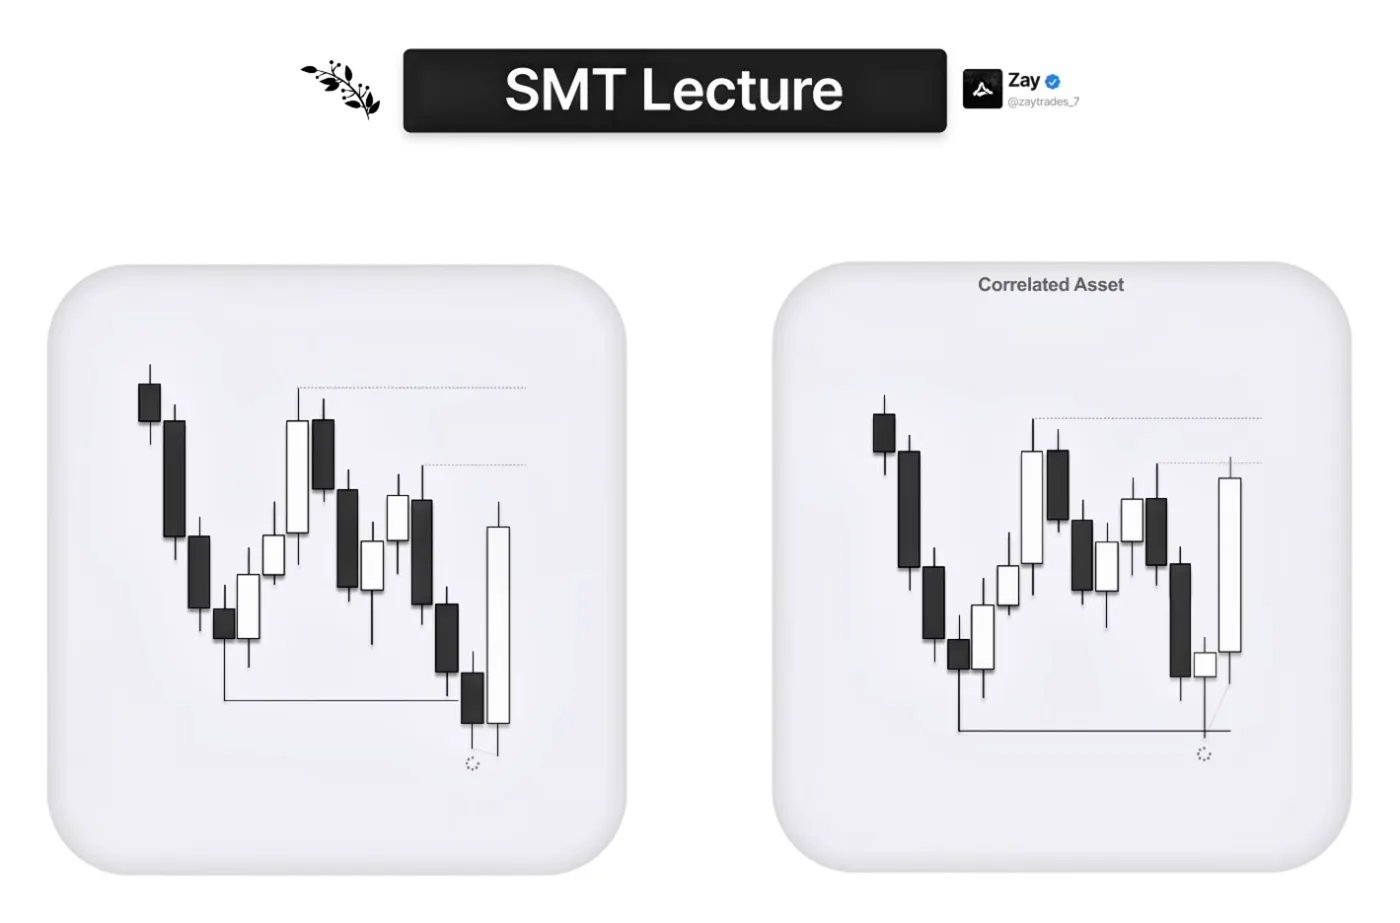
2-stage PSP. The last one is simply when we close a PSP and then have an SMT on the PSP's low or the PSP's high. It can happen in a lot of different ways, but in this example both assets come to the low; the weaker asset closes bearish and the other closes bullish. We can anticipate a 2-stage PSP here because the bearish candle closes near its low, near the wick, while the other candle opens very far away from the low. That is how you know a 2-stage PSP is likely to form in the next candle, and that is what happens: we have the first crack in correlation, the PSP, and then one asset takes out the low and the other does not. Again, if we wanted a long, it would be on the asset that did not take out the low.
That is all there is to SMTs.
Strength Switching
Strength Switching is very powerful in your trading, because you can always be on the right side of the market. Even when, for example, NQ is clearly stronger than YM on the higher time frame, on an intraday basis YM can still switch to the strongest asset, and you can capitalize on that via the Strength Switch.
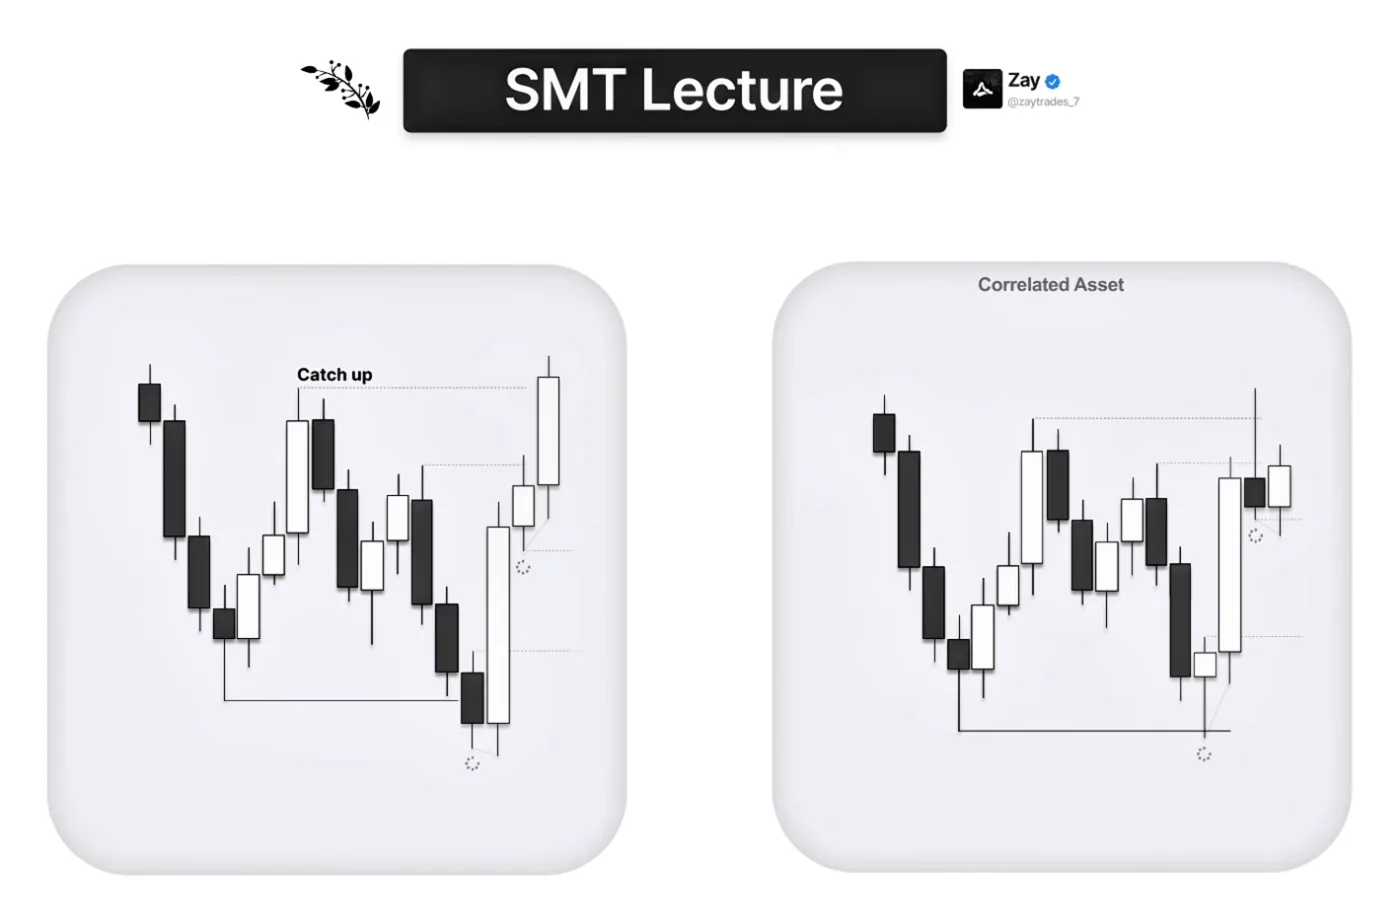
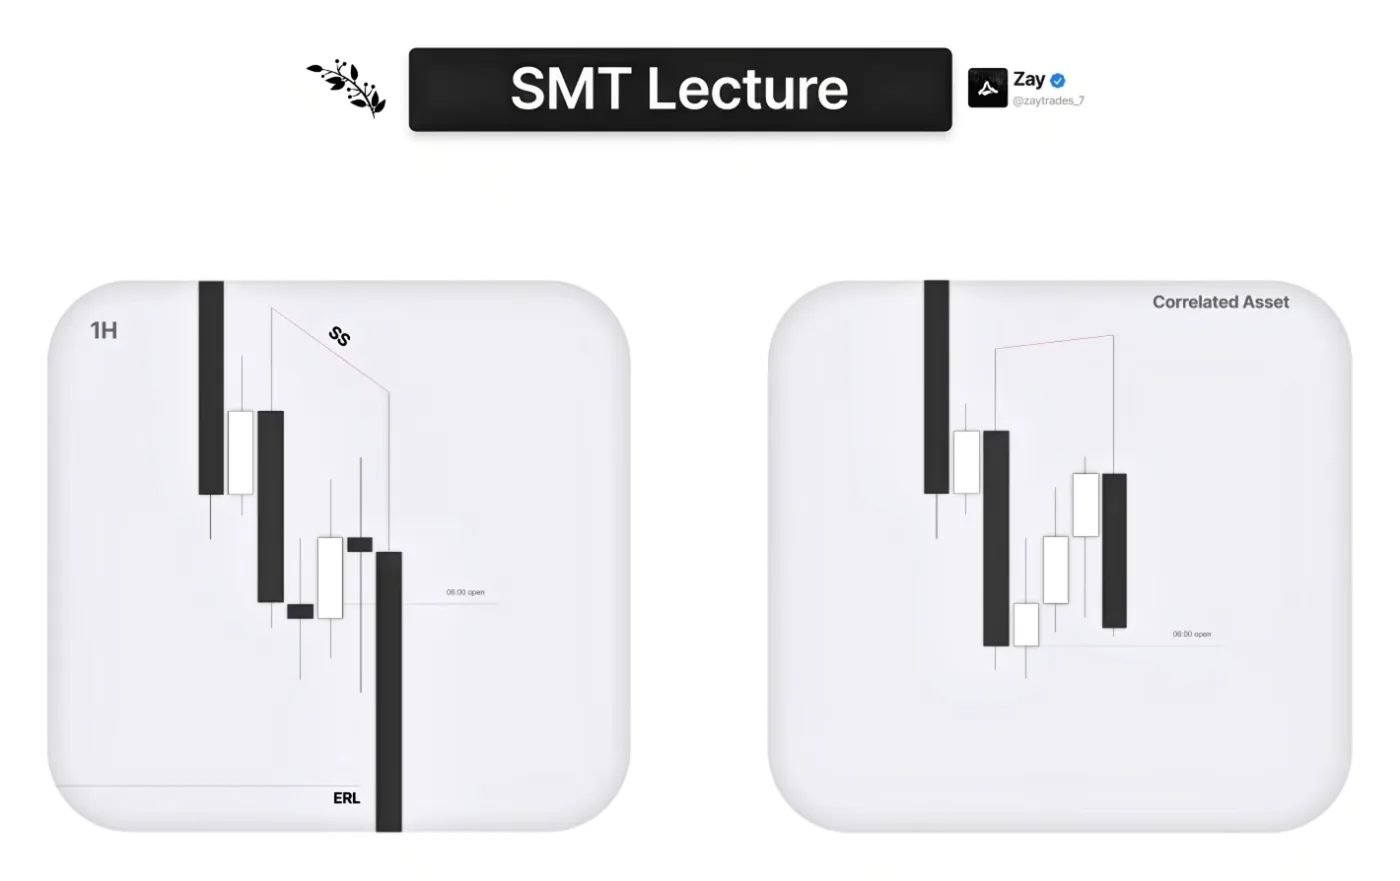
In this example we use the Strength Switch to catch up to the same high that the previously stronger asset has already hit. The asset on the left used to be the weaker asset: it is the one that closes bearish and takes out the low, the one that formed the 2-stage PSP we mentioned earlier. The other asset is clearly stronger: it closes bullish, it does not take out a low, and that is why it expands into the highs while the weaker asset does not. On the weaker asset we are still far away from the high. That is when the Strength Switch comes in.
The first sign of a Strength Switch is when the stronger asset closes bearish, when it should be the one closing bullish, and the weaker asset closes bullish. We also formed a gap away from that initial expansion, so we have a refined key level if we want to frame a continuation. That is why the Strength Switch is so powerful: the stronger asset already did its job, it already hit the high, but the other asset has not, and that is when the Strength Switch normally happens. Here we have a Strength Switch via a 2-stage PSP inside a gap, also an SMT fill, and that is why this asset switches to the strongest asset to take out the high and catch up to the same high the other asset had previously hit.
A quick example. We are on the daily time frame with two assets. Neither has anything meaningful to tell us: we have not engaged the relevant low, and we have not engaged the gap on either asset. But we are closing the day near the gap, so it makes sense that we can open high first, place the daily high there, and then go for the failure swings at the lows. That is what makes the most logical sense, and that is what we get. One asset is the stronger asset: it takes out the high and fills the gap, and on the other asset we have an SMT fill inside that daily gap. So the other asset takes out the relevant low while the stronger asset does not, and we currently have an SMT there.
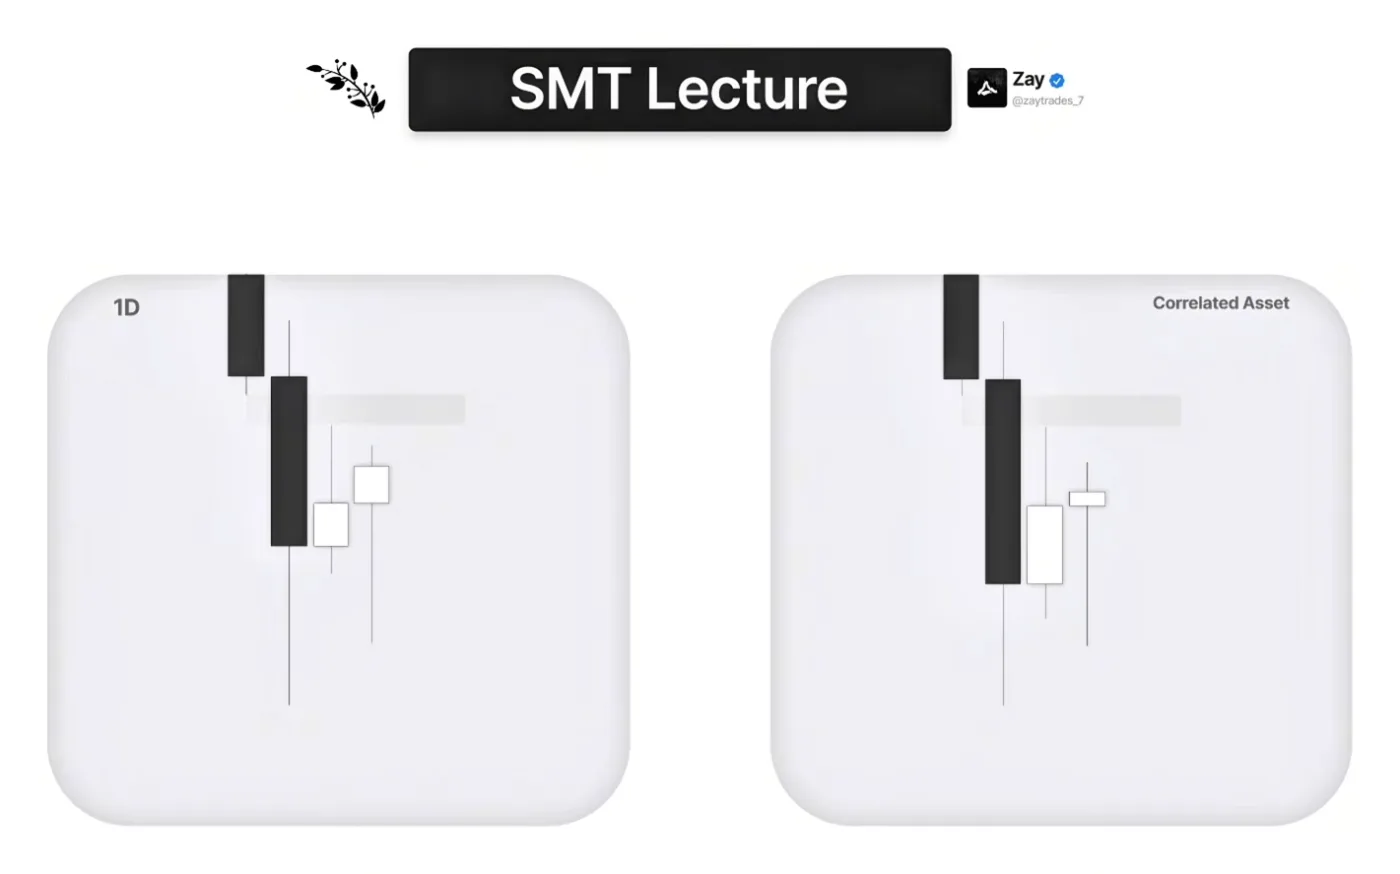
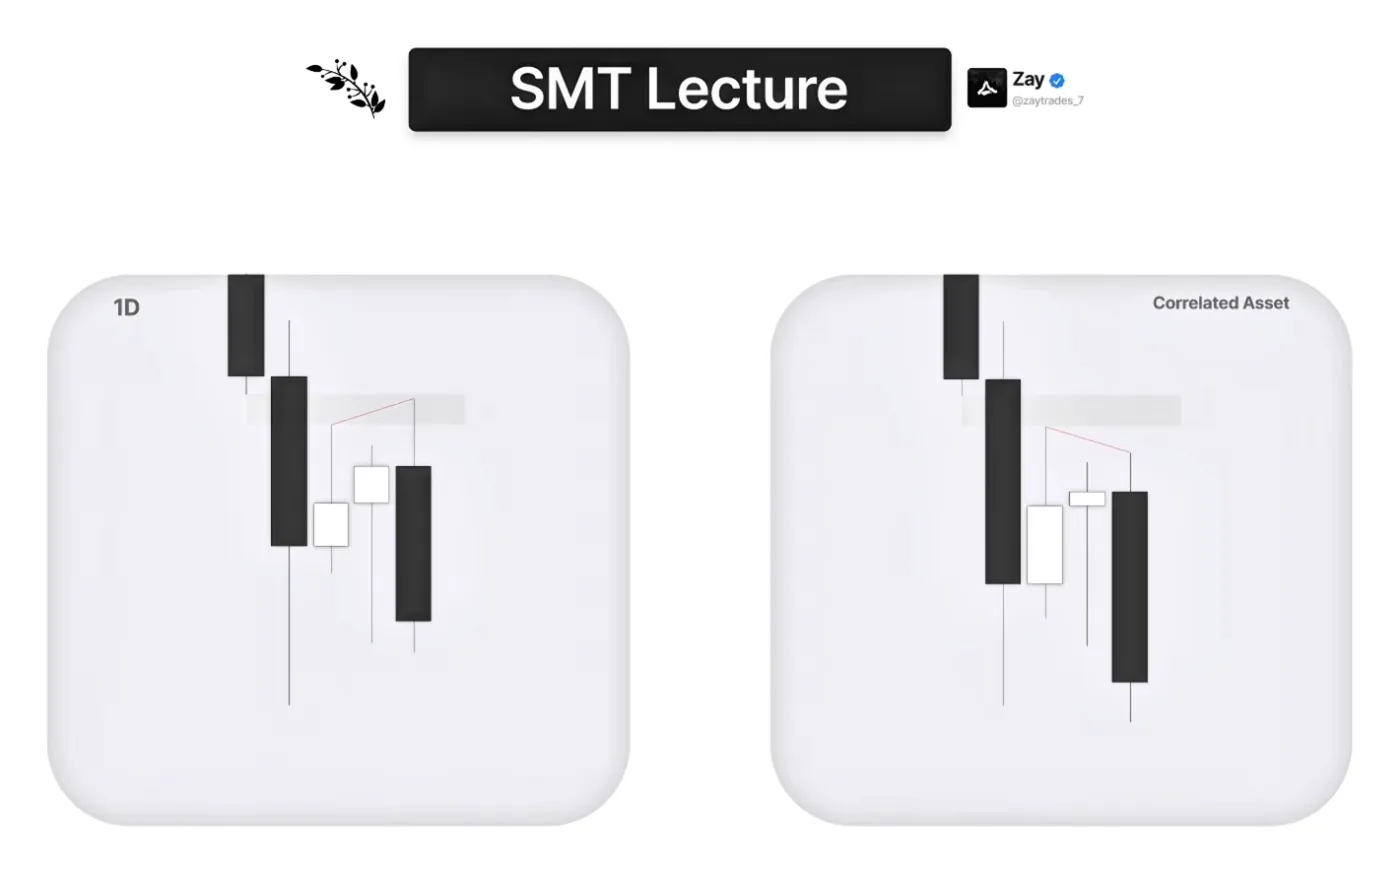
But we do not want to be longing away from that, for two reasons. The first is premium and discount, which we go over in depth in a bit: if we frame the range from this candle, we are too close to the low, too deep in discount, and we do not want to see price reverse away from discount SMTs if it wants to go up. We want a more spaced-out SMT. The second is that these two assets did not even expand away from the low; we kind of failed to manipulate. Those are two red flags telling you the market does not actually want to go up.
Now we want to be trading a continuation, and ideally we have a Strength Switch on an intraday basis to catch up to the same low the other asset hit the day before. To catch an expansion candle, a continuation, we need this candle's high to be placed below 50% of the previous day's range, and we get that. So we can drop down to the lower time frames, look at the 4 hour, see the profile and align ourselves with price.
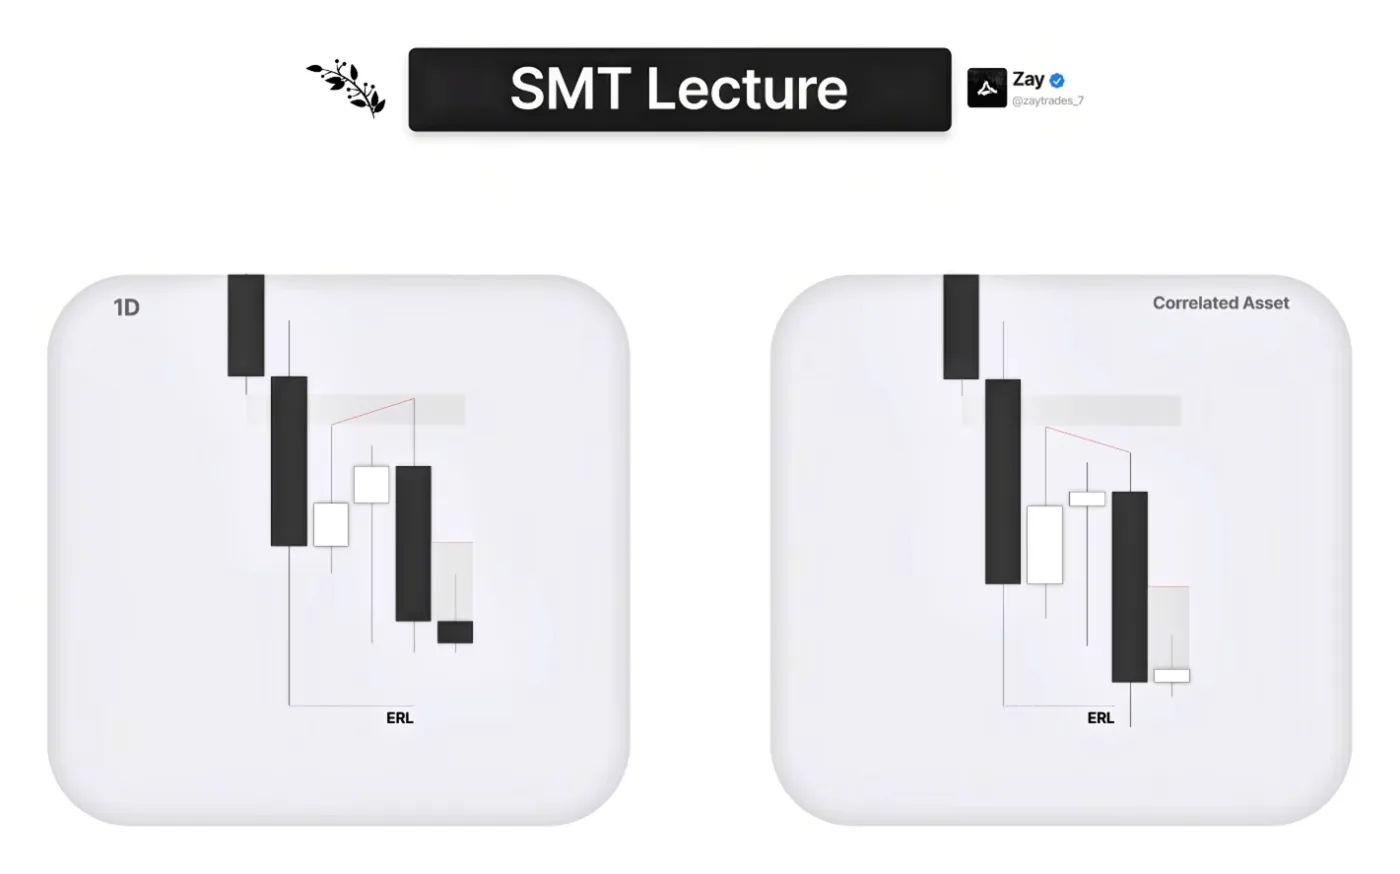
On the 4 hour, the expansion from the previous day made lower time frame gaps. That daily expansion made a 4 hour gap, like we said on key levels: we always make gaps after we expand. And we have a Strength Switch inside the gap. We do not have an SMT fill on the gap, both assets dig through it, but we have a Strength Switch there. Even prior to the SMT on the high, we had already switched strength. How can we know that? Look at the move from the low to the high: we are expanding away from the low on one asset, but on the other the move is shallow, very small. That is actually the first Strength Switch. I do not see people talk about it, but it is a Strength Switch by itself, because that used to be the stronger asset, it did not even take out the low, so if we were going up we should be going up more on that asset. That is the first red flag, and the ultimate red flag is the Strength Switch on the high with an expansion away from it.
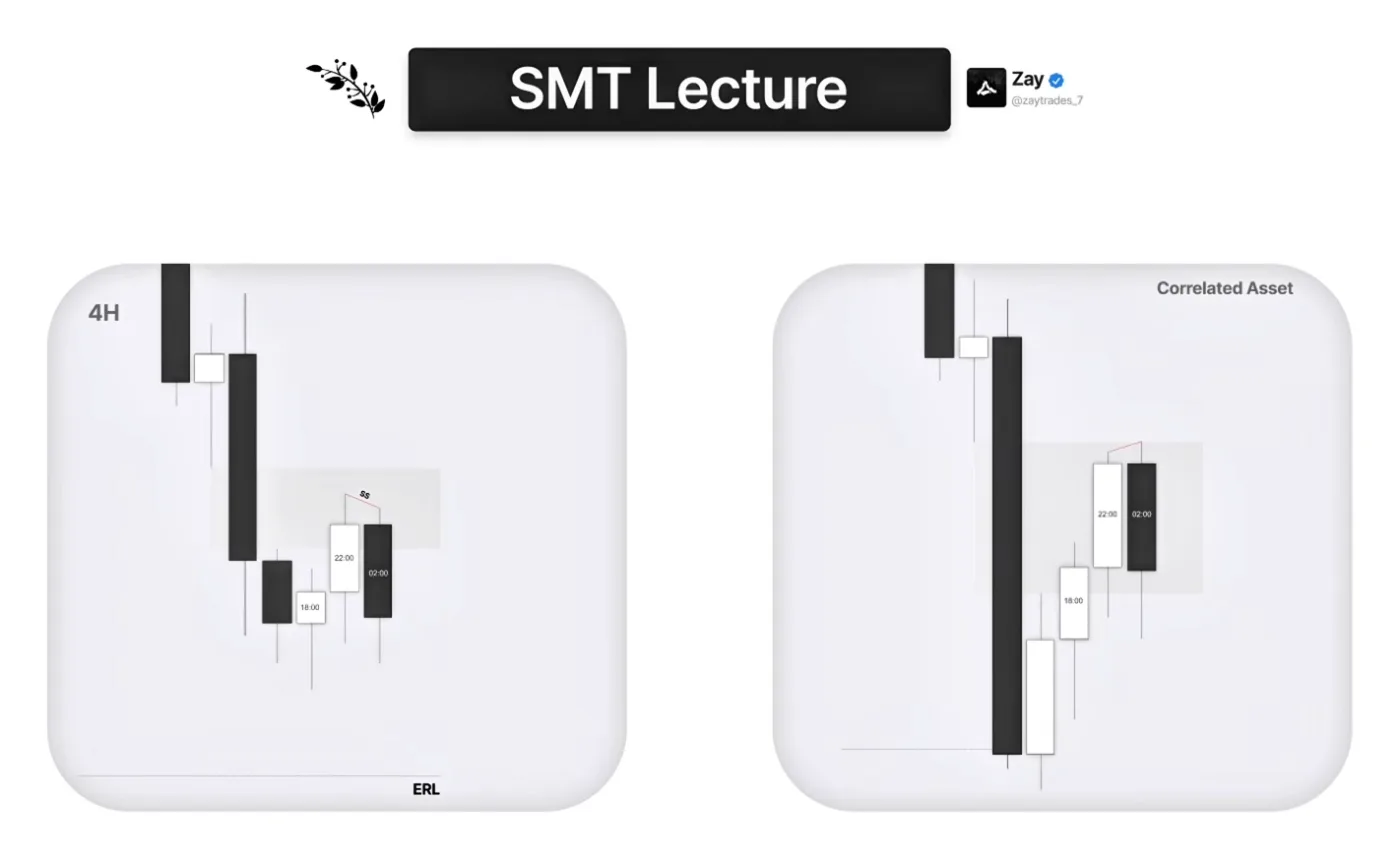
So now we want to be trading this, and we need to align ourselves with the 1 hour and 30 minute swing point. On the 1 hour, we did not expand away from that 2 a.m. Strength Switch on the current high of day; we stalled after it and did not even use the gap to send us lower. Now 6 a.m. opens and we are trading at 9: counting the candles, 6, 7, 8 and 9. Inside this hourly candle we have 9:30, the equities open, which brings a lot of volatility into the market. And we have another Strength Switch here: this high is a relevant high, and the asset that once used to be the weaker asset takes out the high while the other does not. That can send us lower. All we need is to align ourselves with a lower time frame V-shape, and once we get that we should expand and catch up to the same low we hit on the other asset.
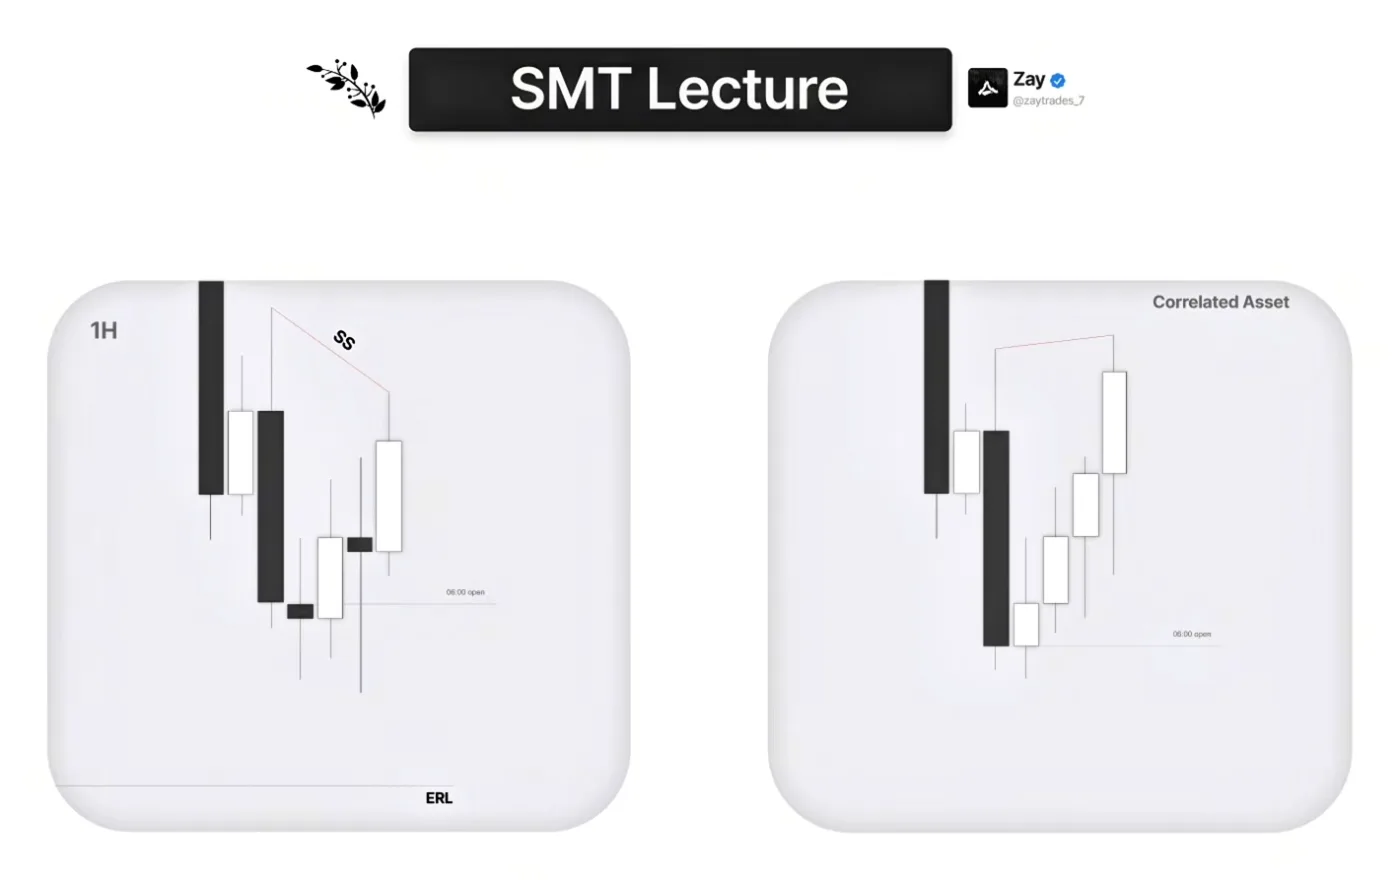
One more thing: the reason we can fade this large wick and still expect this candle to be an expansion candle is that 9:30 happens inside this hourly candle. 9:30 brings in a lot of volatility, so we can expect it to expand a lot, and the wick is not going to be that meaningful.
Premium And Discount (Filtering Ranges)
Premium and discount is another powerful tool. It is used to filter ranges and much more; you can even use it to know where to place your stop loss on the lower time frame. In this example we again have two assets: one clearly weaker, because it takes out the relevant low, and the other holding the SMT fill. We are probably going to the high, most likely, because we are expanding away from that SMT fill in a very aggressive way. It is clearly intentional, and it is likely we hit the high.
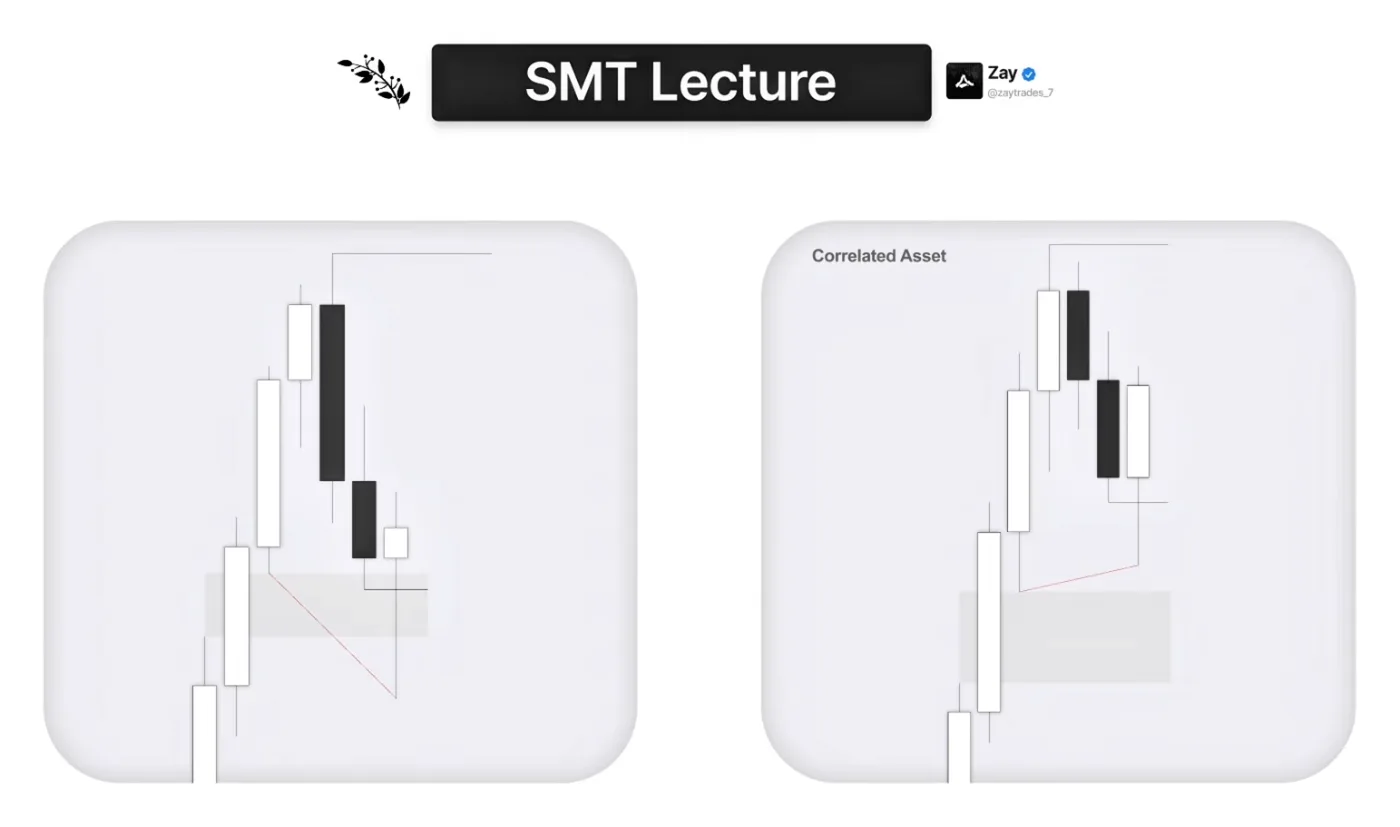
After we hit the high, we have another SMT on the highs. But this SMT, like I said in the earlier example, is unlikely to hold, because of premium and discount. It is too deep in the premium of the range. If we mark the range from this high to this low, this high is pretty much a failure swing to the high: it is near the high, in deep premium of the range, and that is when you can expect these SMTs to break. In theory we should not expand away from this SMT. Sometimes we do, but we cannot anticipate that. We can trade away from it later on, but in the ideal scenario the SMT breaks, and that is what happens.
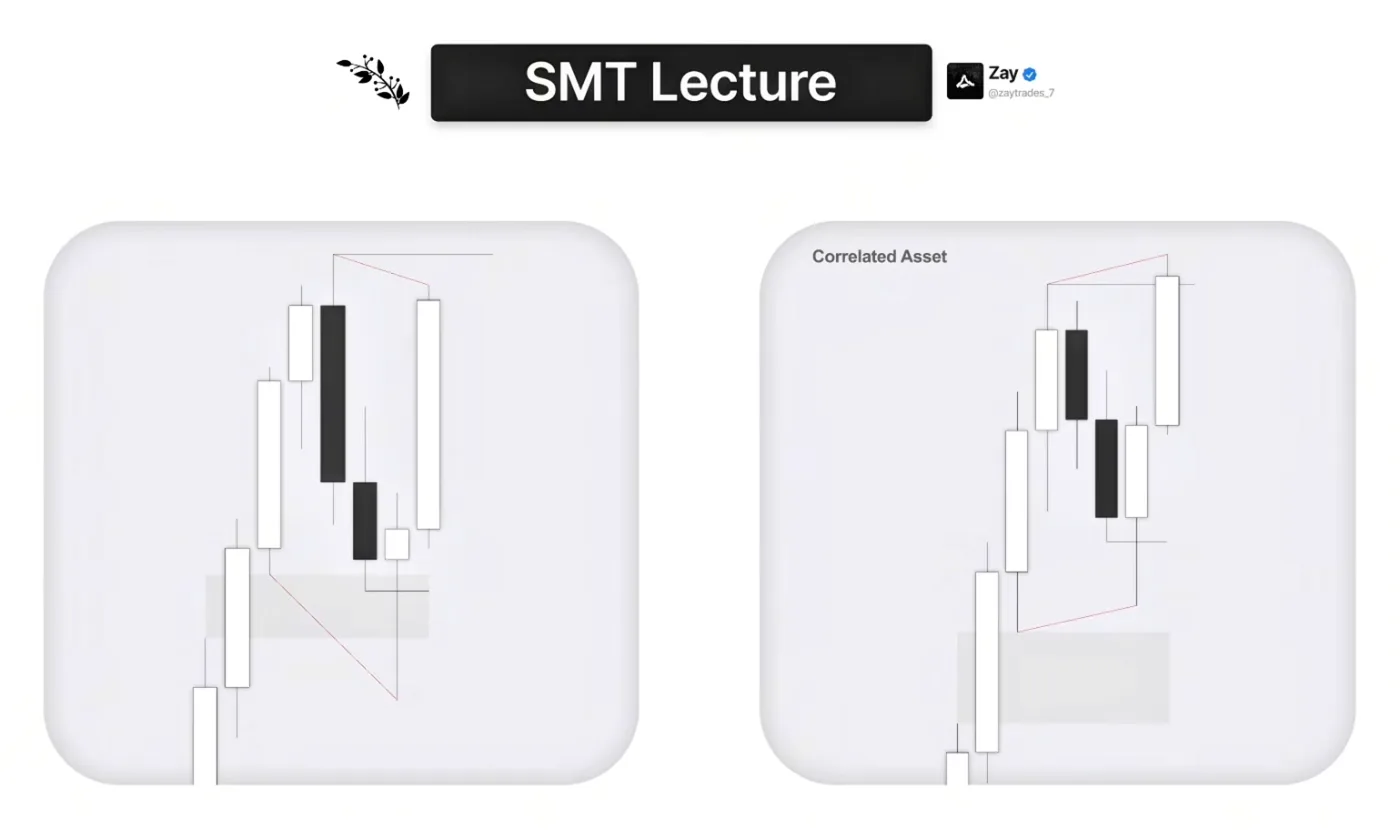
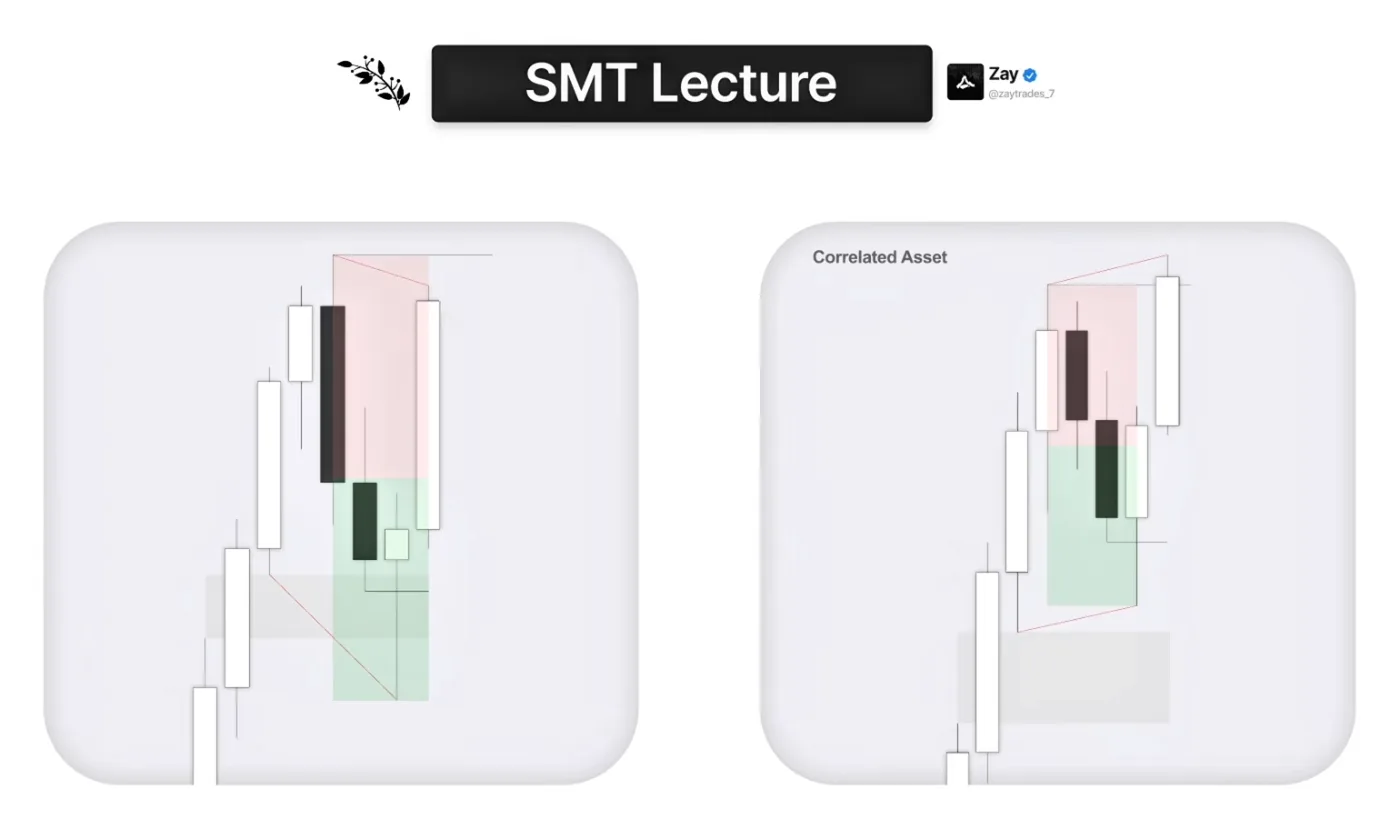
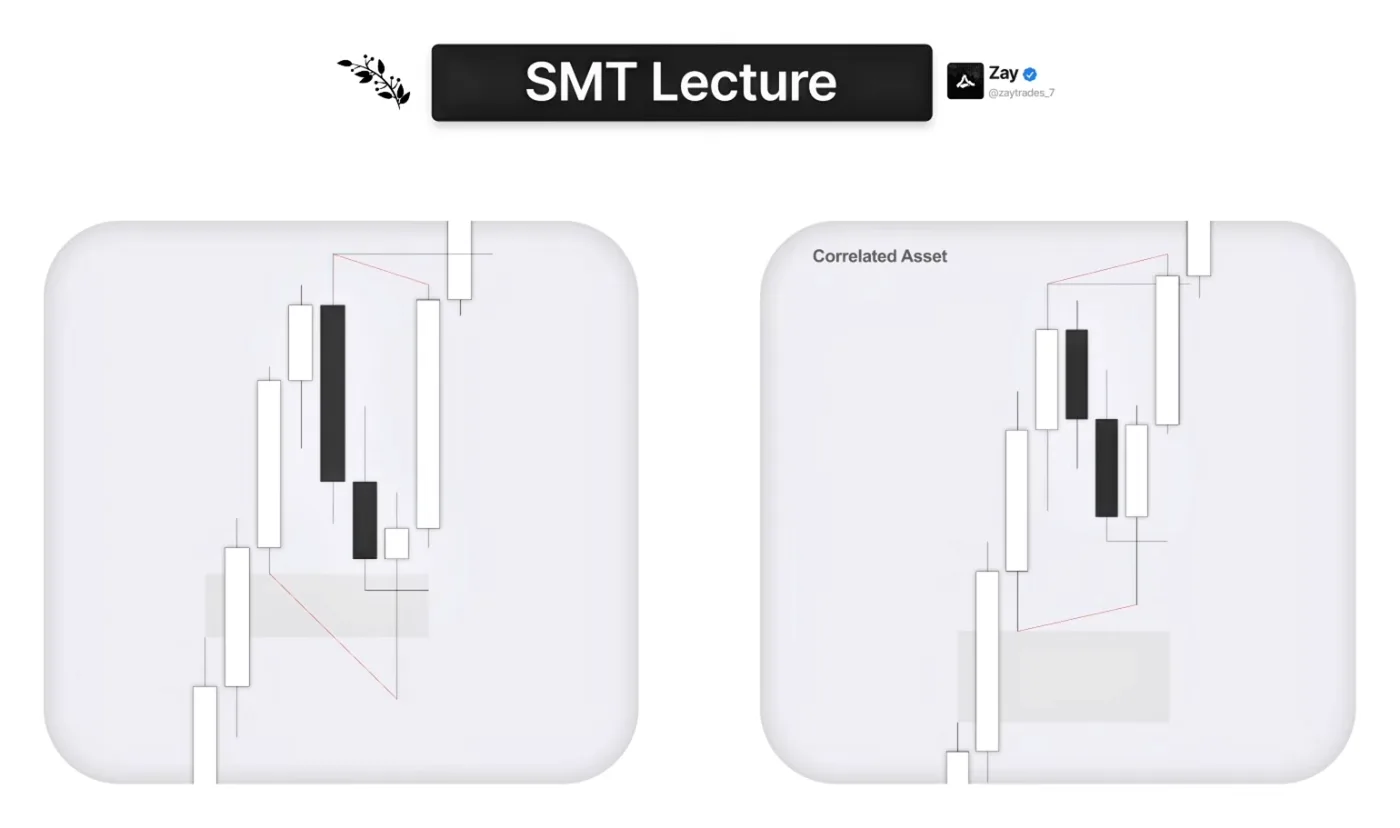
Advanced premium and discount is different. Now one asset is at the high, we take out the high and we have an SMT, but instead of the other asset being all the way up there, it is in the EQ or discount of the range. Since the SMT is now spaced out enough, that is when you can anticipate it to hold.

Move on to the next candle: it opens up and we form a Strength Switch. This is the highest probability 2-stage SMT sequence you can see. Remember, when we went over the SMTs, the 2-stage SMT the way I showed it was the lowest probability one. This is the highest: we form the house formation, the roof formation. This is the highest probability Strength Switch, and after we get it we can expect price to expand, because this asset is not in premium and we get the Strength Switch. Everything is aligned. All we need to do is confirm that swing point with a lower time frame V-shape, and once we get it we should expand, and that is exactly what happens.
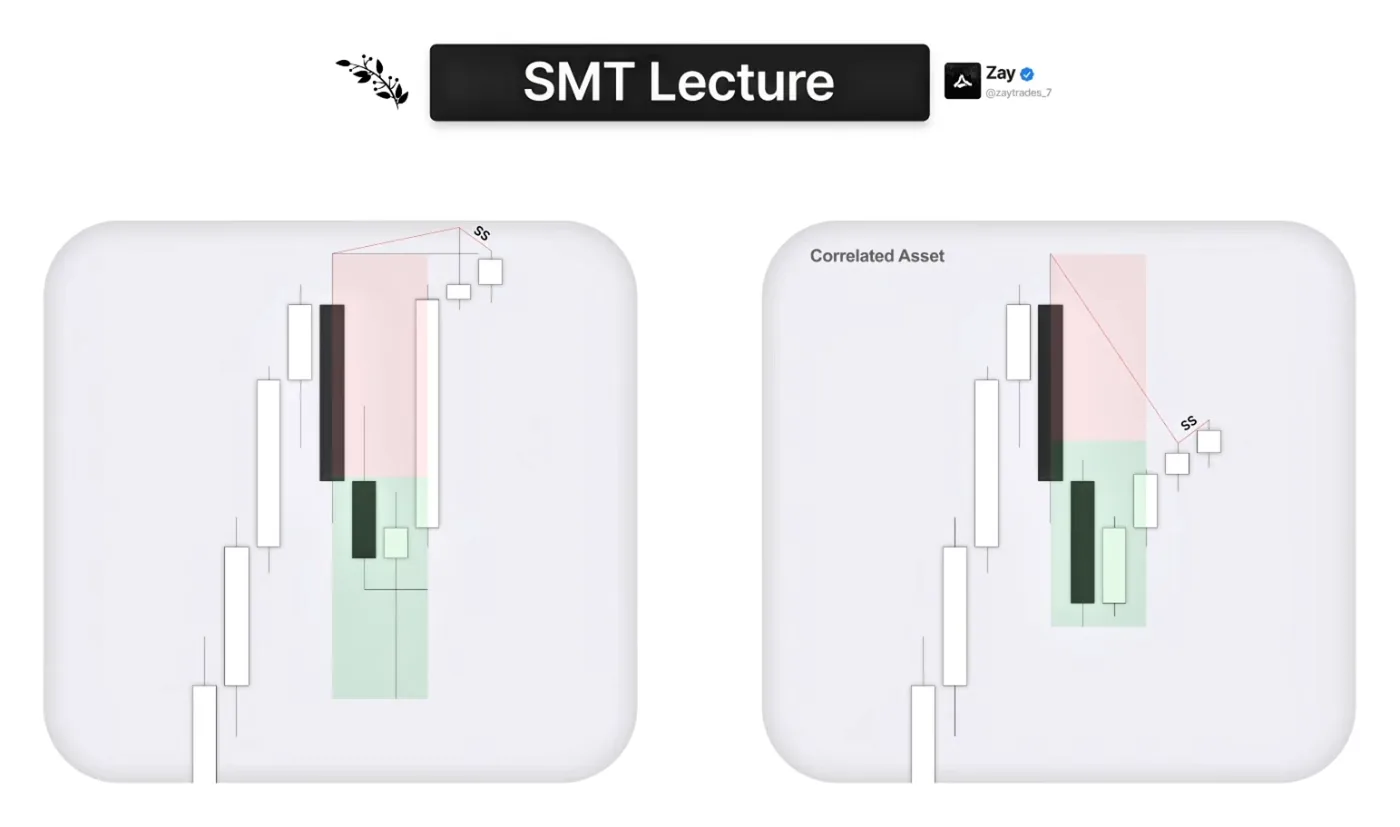
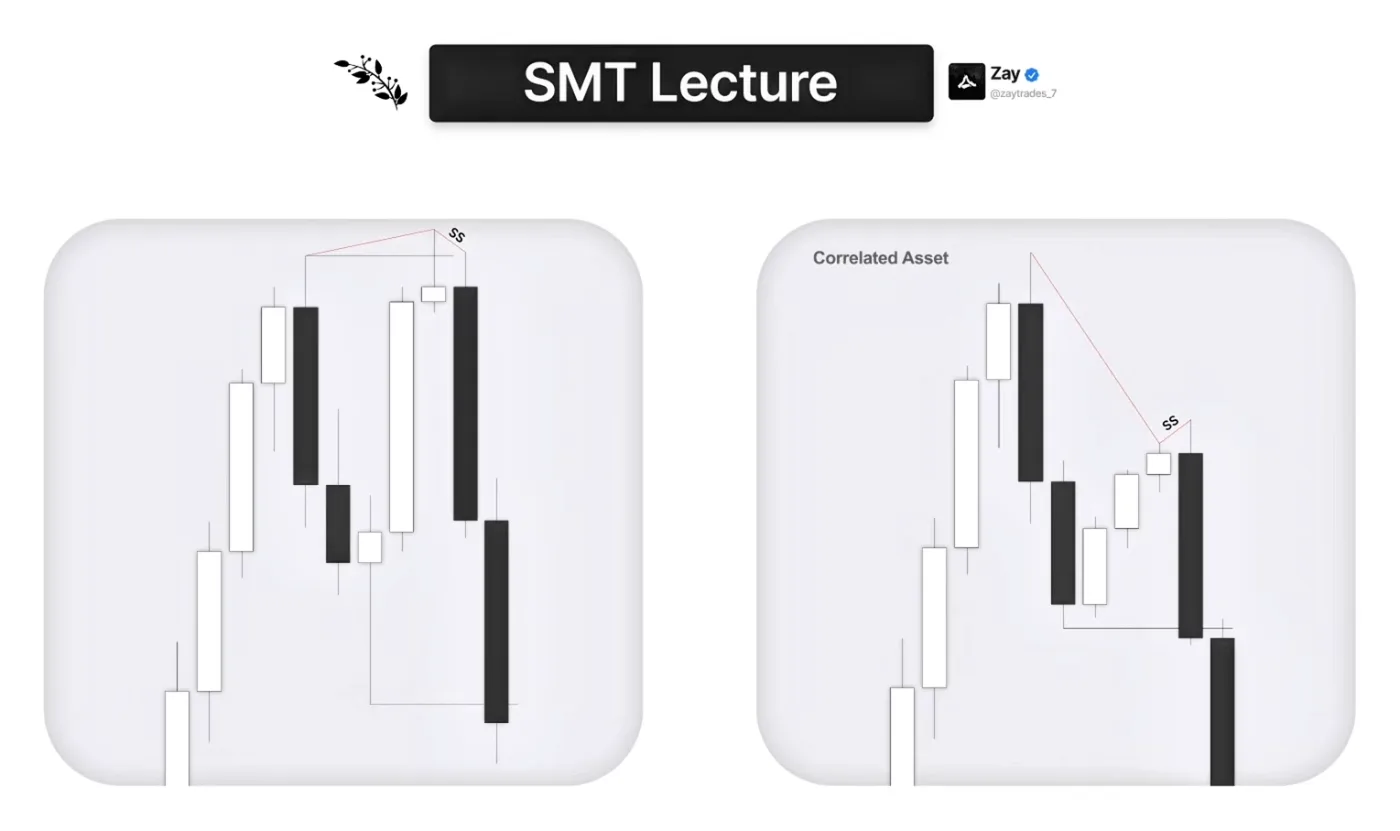
That is how you filter SMTs and know which will break and which will hold, so you avoid pattern-trading SMTs and always position yourself with the higher probability market.
You’ve probably got some questions...
Learn The Lathyrus Model with direct guidance from our coaches.
- 10 live streams every week
- Regularly updated in-depth course
- 450+ hours of live stream recordings
+ more
Entry Signatures
Lastly, before the examples, the valid CISD, the entry signature. I put this here, even though it seems random, because I do not see people stress it enough. Many of you focus on the patterns on the higher time frame and do not care how the lower time frame looks, which is a very big mistake.
This is what you will see in every single one of my trades. I always demand this type of V-shape: a clear, intentional move away from the SMT that does not take much time to form. It is very aggressive and intentional. Here it takes just one candle; it can take two, but more than that is pretty much already a red flag. You want to see this bulky signature. If you miss it, you can always take the gap, because the gap is another way to see that we are expanding away. So you can take the gap if the RR was not sufficient or you missed the first entry.
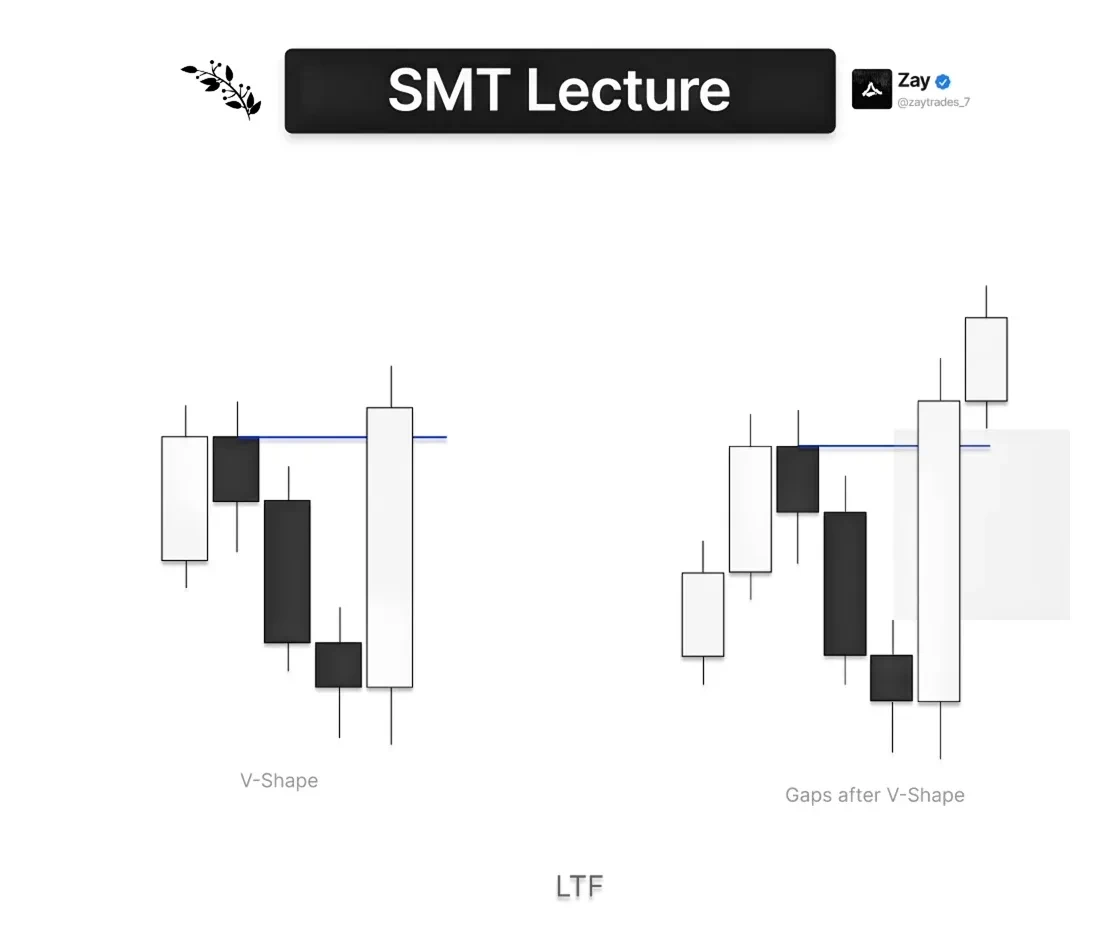
Why is this good? Because it is intentional, and intention is good: now you are no longer alone. The market is telling you it is aligned with your thesis. If you wanted a long and the market does this, you clearly know the market wants to expand. That is why this is so powerful, and why you need to avoid the other signatures.
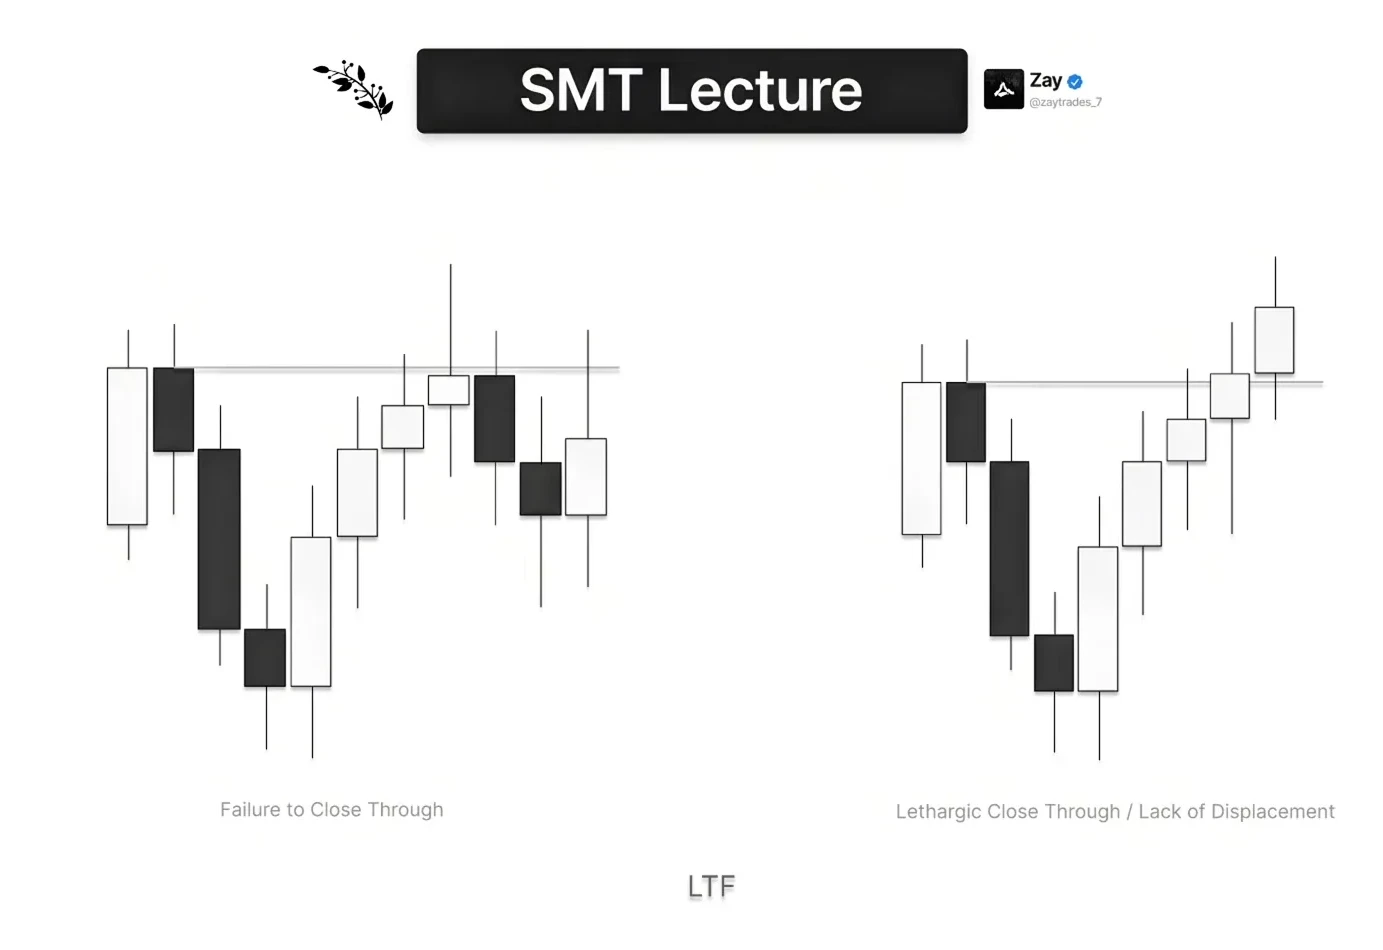
The first invalid one is not even valid to begin with, because it does not close above the series of down-close candles; we have a failure to close. But I see many of you take the next one: the lethargic close, the lack of displacement, taking four candles to close above the series of down-close candles. That is a low probability signature and the market is likely to just consolidate. If you think logically and neutrally: if we are moving away from the SMT like this, and it is not even expansion, why should the market just expand now that we closed above? It should just stay like this. It should not randomly expand after moving away in a lethargic way; it should keep being lethargic. That is how you avoid pattern trading: if it looks like this, the market should keep making candles like that. I promise you, if you focus on taking the valid signatures and avoiding these, your win rate will probably increase by about 10 to 20%.
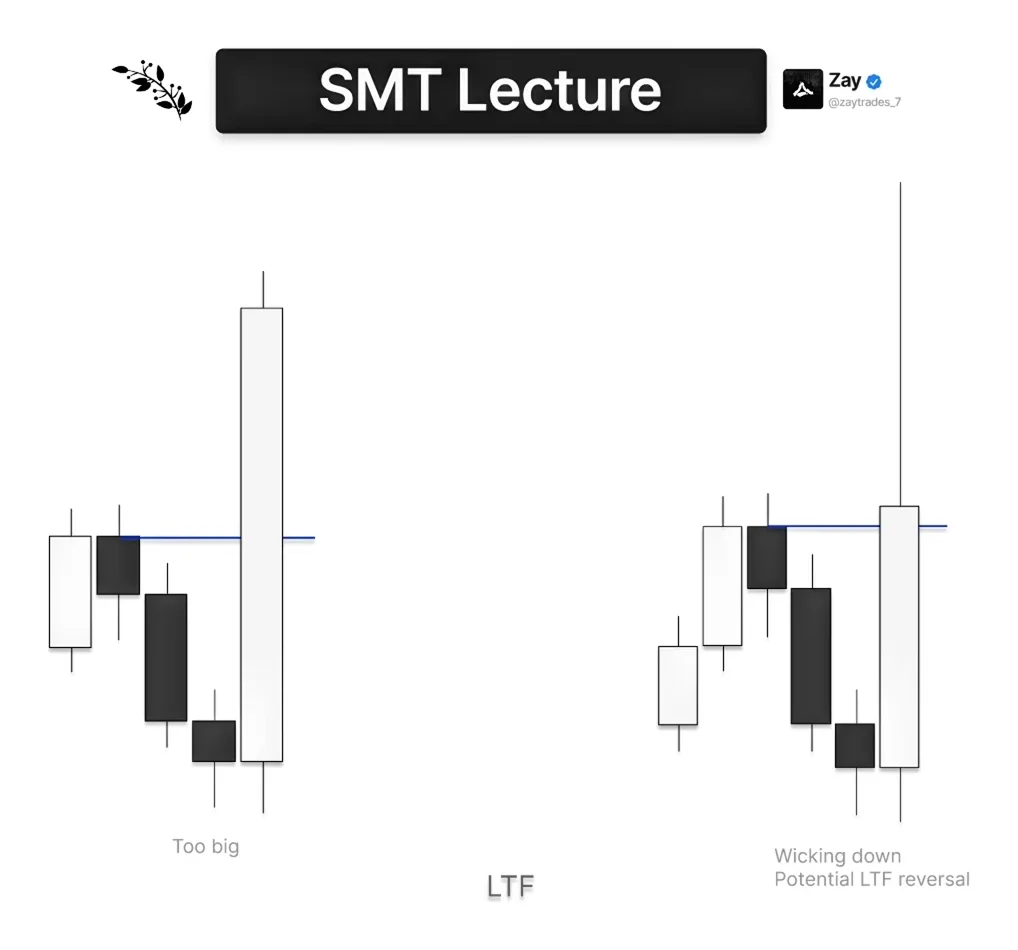
The other type of invalid signature I do not like to see is the market completely exploding away from the SMT. It is just not favorable: your stop loss will be too large and the RR will not be sufficient, so I usually let the market go without me. The only thing you can do is take the retest, but again that is on the lower probability end, because if price is going to retrace all the way to 50% of the candle's range to then go up, it is probably not going to expand that much. If we are clearly expanding, it should not even return there; it should just go. In the last example we come down in a very aggressive way, pretty much 50% of the candle's range. We still close through, but it is immediately lower probability, because we are pretty much reversing away from the high. I do not really trust these signatures either.
Practical Trade Examples
The chart examples were all live-conducted examples, so please refer to 28:17 in the YouTube video accessible on the right-hand side of this page.
That's the end of this lecture, I hope you found value reading this and you learned something new that you can apply, or further refined your knowledge on this subject.
Back to the top