Introduction
In this lecture I teach you about advanced premium and discount, SMT breaks and a little bit of Strength Switching. This one lecture gives you everything you need to know about advanced premium and discount and SMT break sequences.
Advanced Premium And Discount And SMT Breaks
How To Define A Range
To understand advanced premium and discount, we need to start at the very root of it, which is how to define a range. Defining a range is a lot simpler than it sounds: a range runs from a range high to a range low, and both the high and the low are founded on a swing point.
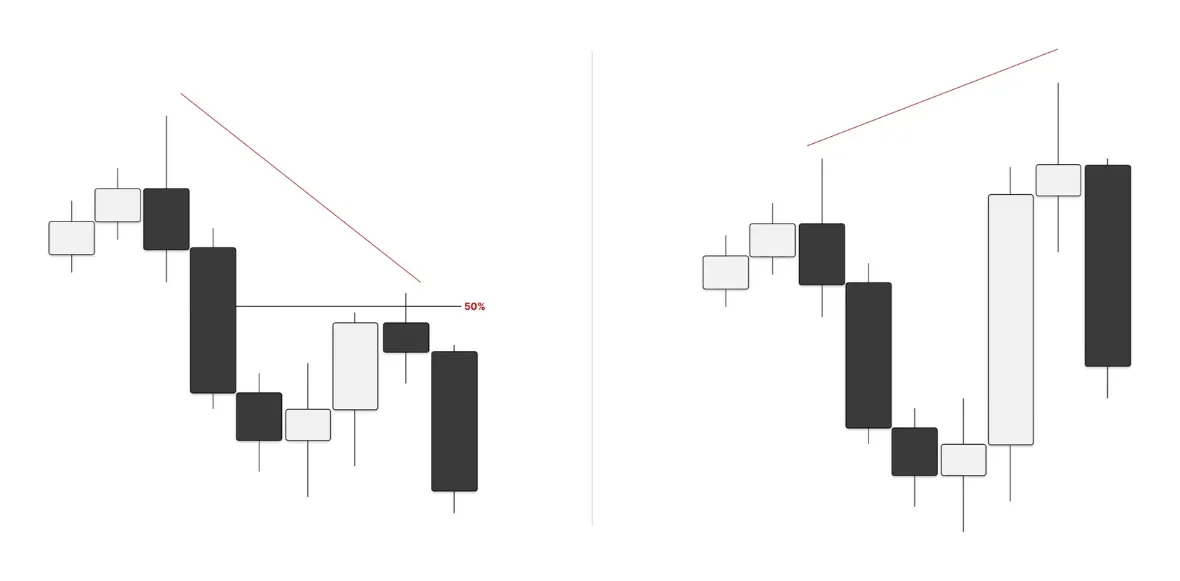
Take the low: this candle has no candle going lower to its right and no candle going lower to its left, so it is a proper swing point at the low. The same goes for the high. When you mark out your range, you mark it from that high to that low.
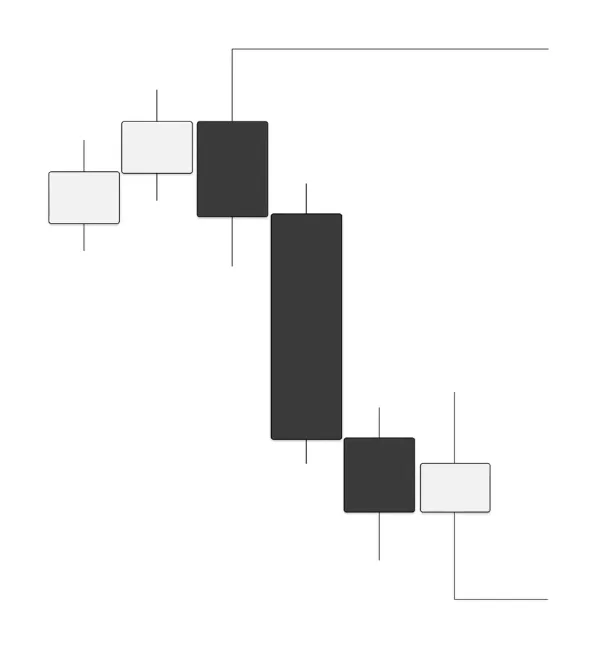
Here is the range properly marked out. Notice that the gap left by the large bearish candle lies at around 50% of the range.
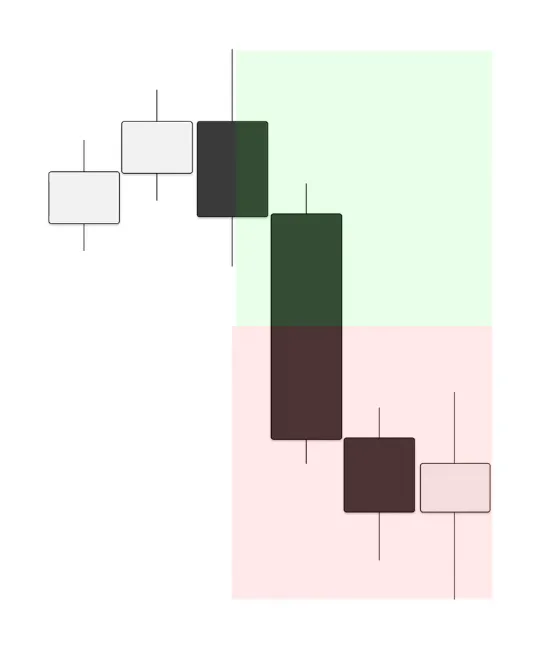
A lot of you may be asking what time frames to focus on to find these ranges. Time is fractal, so you can find these ranges on any time frame, but always focus on your higher time frame, like the daily and the 4 hour chart, as those are the ranges that define the expansion moves of your day.
APD Sequence
Now let's talk about spaced-out reversals and advanced premium and discount sequences, so you can identify them and start using them in your trading. Usually you use this in the context of three assets, a lagging, a leading and a middle, but for this example we are using two, so the middle asset is removed.
The asset on the right comes out, expands higher and sweeps out the high, creating SMT. The asset on the left only comes up to around 50% of the range, forming very spaced-out SMT. This is what I want you to focus on: look at the range and look at how spaced out this SMT is. This is an SMT you want to use for a reversal. It is a clear telltale sign that this asset wants to reverse here and expand lower toward its next draw on liquidity.
Failure Swing SMT
A lot of you might be asking what we do when we don't have spaced-out SMT, and instead have a failure swing SMT, where the SMT is very close. A lot of the time we see price continue through it, or actually reverse from it. So let's get into SMT breaks and Strength Switching.
Again we have two assets. Asset one, on the left, has retraced pretty deep into the range: it is above 50%, leaving failure swings to the high. Asset two has expanded past the high and created SMT at it. What do we see about this SMT? It is not spaced out, and asset one is leaving a failure swing to the key level that asset two swept. This is when Strength Switching and SMT breaks come into play.
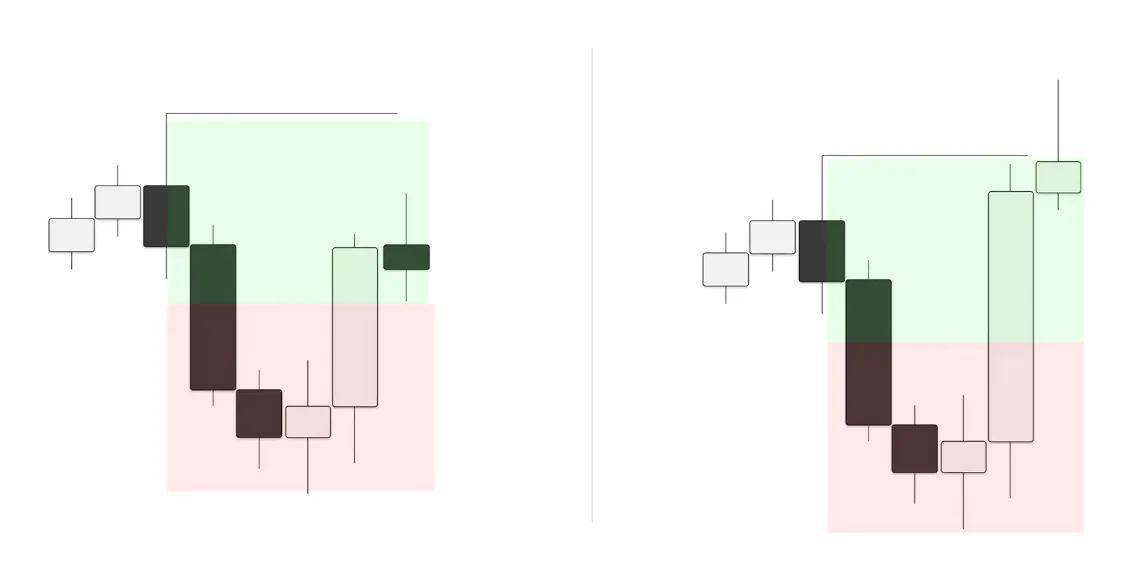
The number one step to identify an SMT break is that the asset that swept the high and formed the SMT fails to reverse. Here that asset fails to reverse, retracing into a gap and forming SMT in it, and that is your Strength Switch. Asset one does not take that gap, which means asset one is becoming stronger and showing willingness to expand higher and break the SMT. You see the follow-through from that gap, and eventually asset one breaks the SMT. Once again, this all stems from a lack of spaced-out SMT and a failure to manipulate on the asset that swept the high.
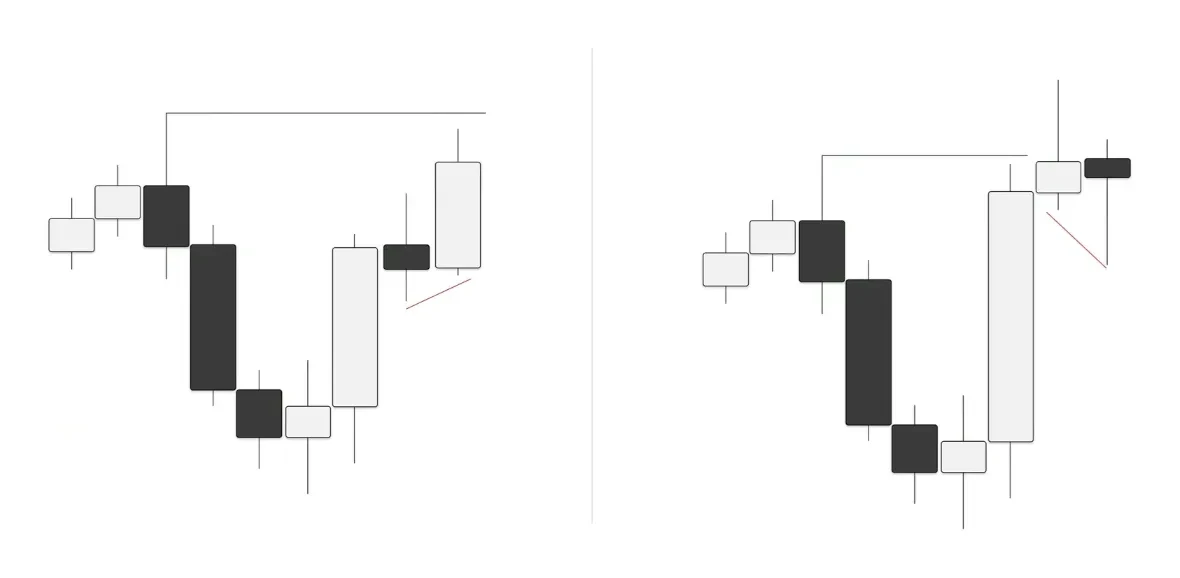
Now that you understand that, let's get into how you can trade away from failure swings. In this example, asset two comes out and sweeps the high while asset one does not, but the catch is that asset one retraces very deep into the range, creating a failure swing at that high. This is not an SMT we want to trade away from, because it is very likely price will come out and break it, since it is not spaced out. Price usually doesn't like to leave failure swings at highs or lows.
So how can we trade away from it? If price fails to show signatures to come and break the SMT at that high, the only way to trade away from it is either with a Strength Switch at the reversal, or with a gap.
First, trading away from a gap. We reverse from the high with significant displacement and form a higher time frame gap. These are usually found on your 30 minute, 1 hour or 90 minute, fractalizing your higher time frame candles. The asset that failed to sweep the high does not trade into the gap, showing signs of weakness, and the asset that did take the high retraces into the gap, forming SMT. From here we have a gap sequence: we move the goalposts, and we want price to respect this gap and then trade toward its next draw on liquidity, as long as the profile allows it.
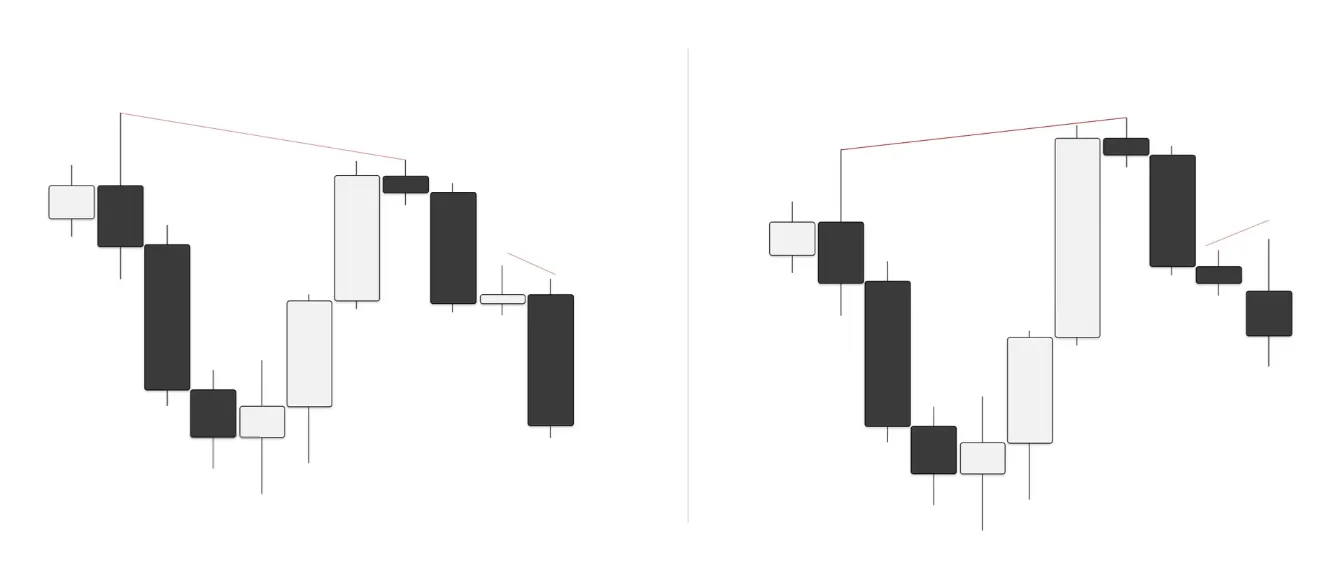
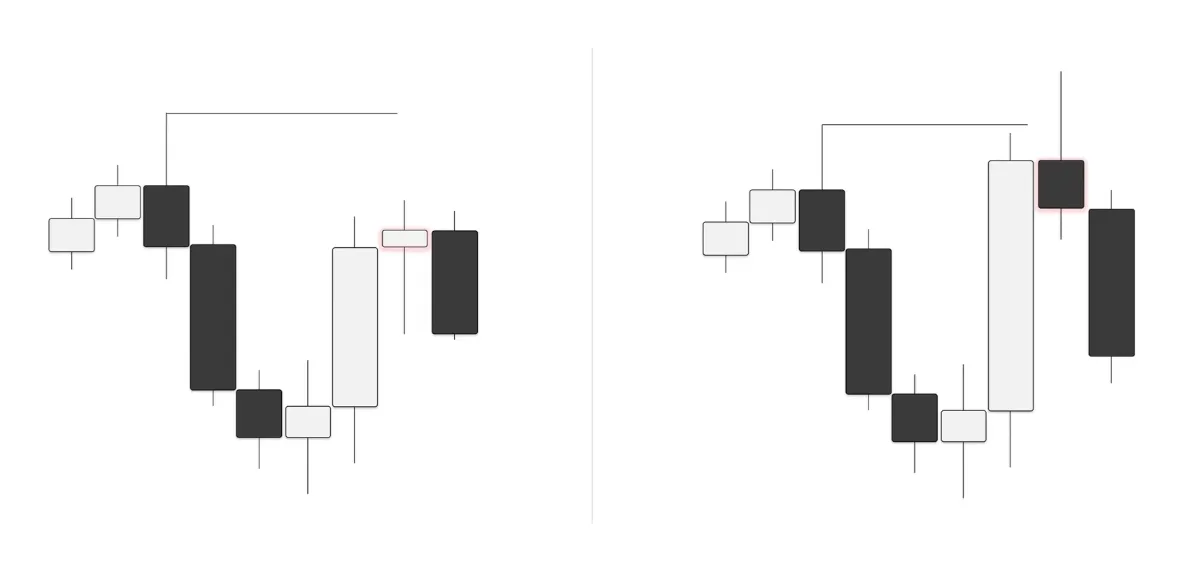
Now the same with Strength Switching. We have a very similar scenario: asset one fails to take the high and we have SMT at it, but again it is in very close proximity to that high, a failure swing SMT, retracing pretty deep into the range. Asset two sweeps the high and creates its SMT. The catch here is that the candle that sweeps the high on asset two ends up reversing. Remember what I said about SMT breaks: one of the key components is that the asset that sweeps the high must not reverse. Here this asset reverses off the high and actually closes as a PSP.
Asset two forms a down-close PSP while asset one forms an up-close PSP, meaning it is a Strength Switch. Why? Because the stronger asset that swept the high is now showing significant weakness, while the asset that left failure swings to the high is showing some form of strength. This means price is most likely to reverse.
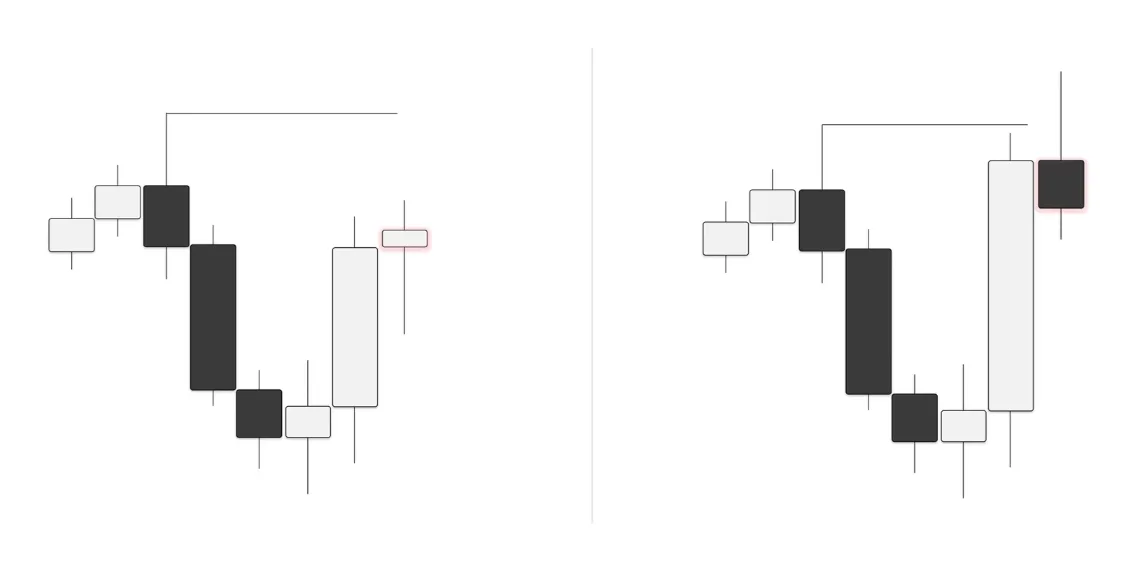
Once we get that Strength Switch PSP, which is also our 2-stage crack in correlation, the next higher time frame candle opens, reverses and trades toward its next draw on liquidity.
Learning it alone isn’t easy...
Learn The Lathyrus Model with direct guidance from our coaches.
- 10 live streams every week
- Regularly updated in-depth course
- 450+ hours of live stream recordings
+ more
Examples
The chart examples were all live-conducted examples, so please refer to 5:58 in the YouTube video accessible on the right-hand side of this page.
That's the end of this lecture, I hope you found value reading this and you learned something new that you can apply, or further refined your knowledge on this subject.
Back to the top